How to visualize data with charts and graphs has become a hot question during this information explosion age.
This guide shows you the simple steps of how to use a professional data visualization program to visualize data with charts and graphs.
Necessity to Visualize Data with Charts and Graphs
Visualizing a large amount of complex data with charts and graphs is easier for human brain to process information than poring over large fonts with poor format. And data visualization does a great job more than this. Following are benefits of visualizing data.
- Visualized data are processed faster by the brain.
- Visuals are committed to long-term memory easier than text.
- Visualized data can tell stories vividly.
- Visualized data can reveal patterns, trends, changes, and correlations clearly.
- Visualized data can simplify complex information for better understand.
- Visualized data are more effective than words at changing people’s minds.
How to Visualize Data with Charts and Graphs
Step 1. Be clear about the question you need to answer when creating a visualization.
Step 2. Analyze data and start creating basic data visualization.
Step 3. Interpret data and generate the most informative indicator.
Step 4. Select a right chart or graphic to visualize data. Different charts and graphs are suitable for different situations. Such as columns are suitable for data comparison while lines are used for data distribution.
Step 5. Use color, size, scale, shapes and labels to differentiate the key messages.
Step 6. A large quantity of comprehensive charts and graphs are provided for users start visualize data rapidly.
Features of Professional Data Visualization Software
Choosing a professional data visualization program makes visualize data with charts and graphics as easy as a pie. Following handy features make this program the exact right software.
- Similar user interface with Microsoft Office enables users to get used to it quickly.
- Thousands of built-in drag-and-drop symbol make data visualization fast and easy.
- Abundant various pre-designed templates for users to download free and customize contents.
- Smart drawing of it enables users to connect, align and space shapes automatically.
- Users are allowed to insert attachment, notes and even hyperlinks to make flowchart much more resourceful and attractive.
- A large quantity of comprehensive charts and graphics are provided for users start visualize data rapidly.
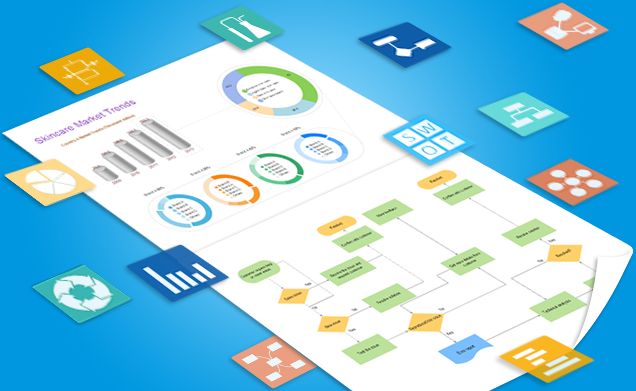
Data Visualization Examples
Following are examples of data visualization drawn by this data visualization program. All the examples are free to download and customizable. Download the examples you like and edit it to suit yourself!


没有评论:
发表评论