Creating business process analysis diagram can increase your business process agility and efficiency, reduce implementation times and enhance quality.
Flowchart maker is ideal for analyzing and optimizing business processes for better productivity.
Business Process Analysis (BPA) is a discipline to identify business needs and provide solutions to business problems so organizations can achieve their goals and objectives. The main purpose of it is to solve the real problem and build the right solution. It uses various tools and methodologies to look at business processes in a variety ways and monitor the efficiency, productivity and more. analyzes various business operations classified into processes.
A flowchart is a type of diagram which represents a process with different symbols containing information about steps or a sequence of events.
Steps to Create Business Process Analysis Diagram
Flowchart maker is so smart that it can make business process analysis diagram drawing an interesting and effortless thing. Below are the detailed steps.
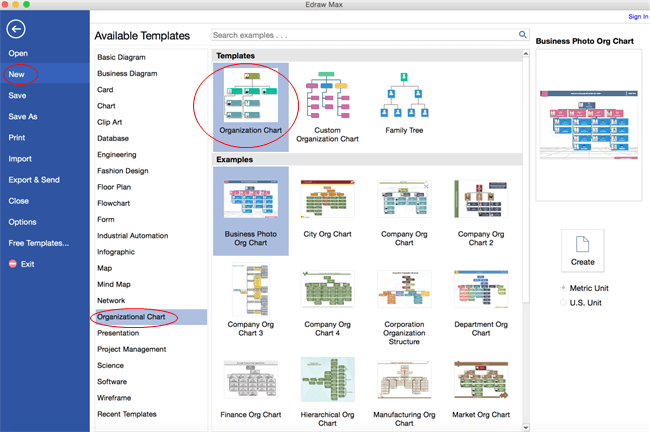
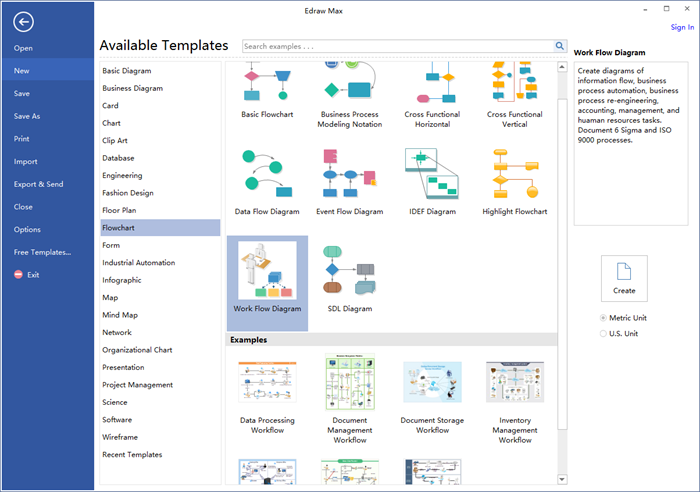
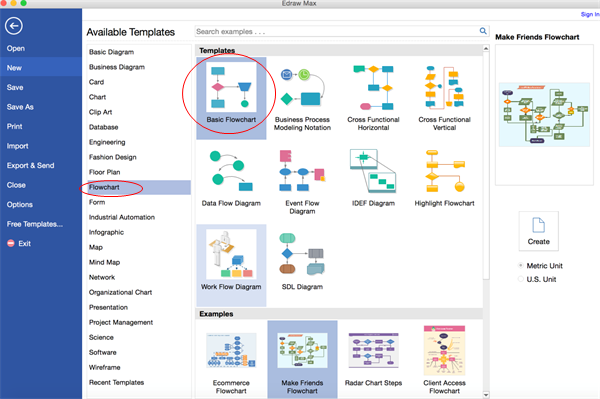
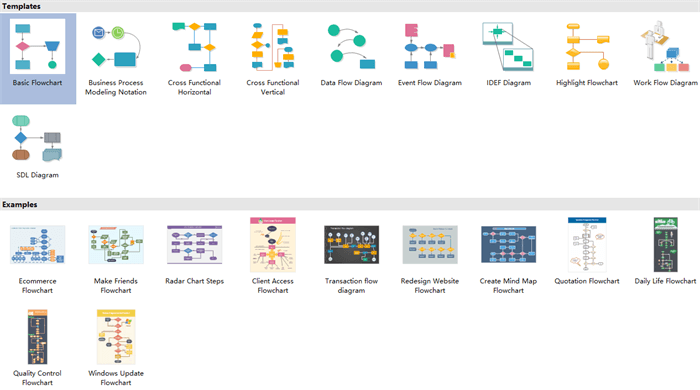
- Run the software, go to the File menu, click New > Flowchart, then double click Basic Flowchart icon to open a blank flowchart drawing page.
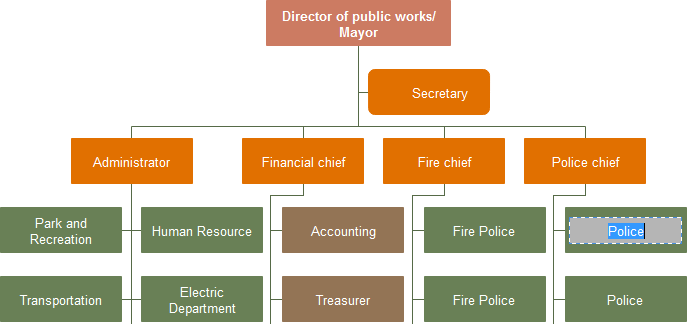
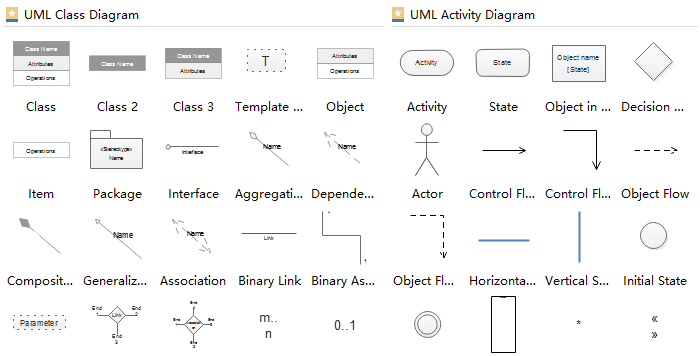
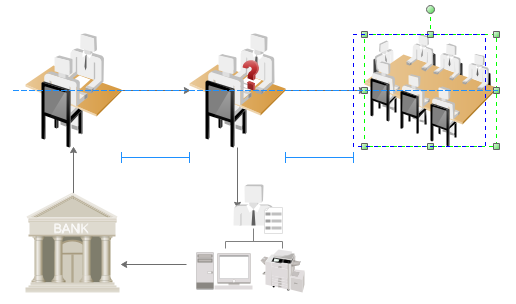
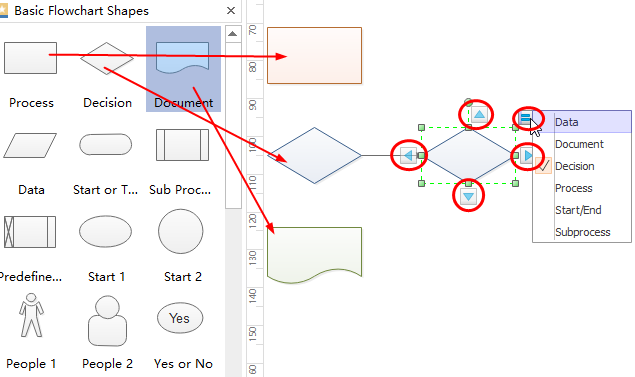
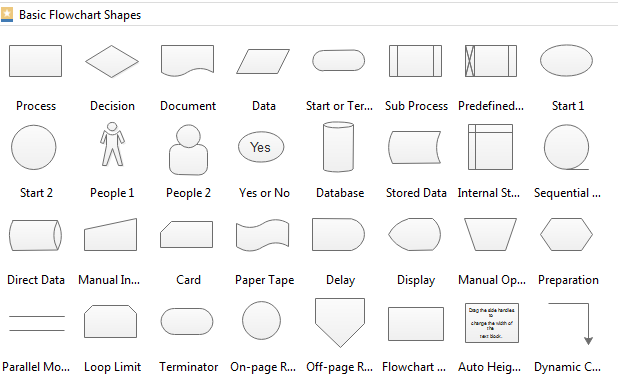
- Drag and drop flowchart symbols from left libraries, then double click symbols to add contents.
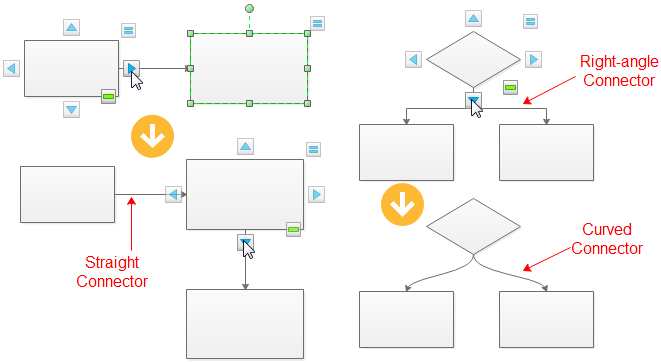
- Click floating buttons around the symbols to connect them automatically or go to Connector and choose a correct connector to connect symbols manually.
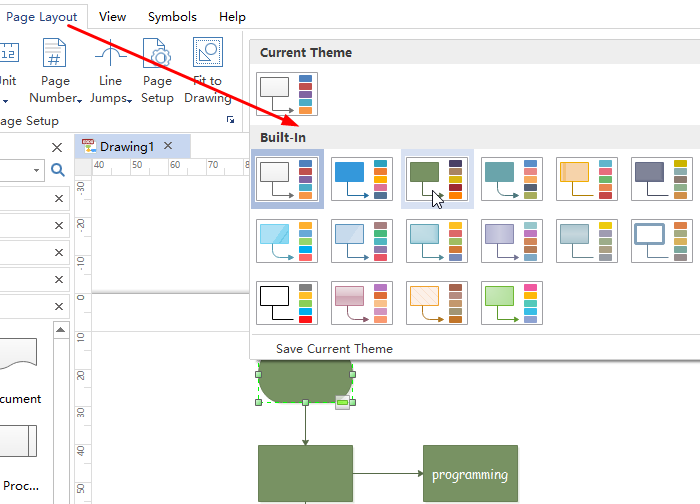
- Navigate to Page Layout and change the theme from various built-in themes if you are not satisfied with the current one.
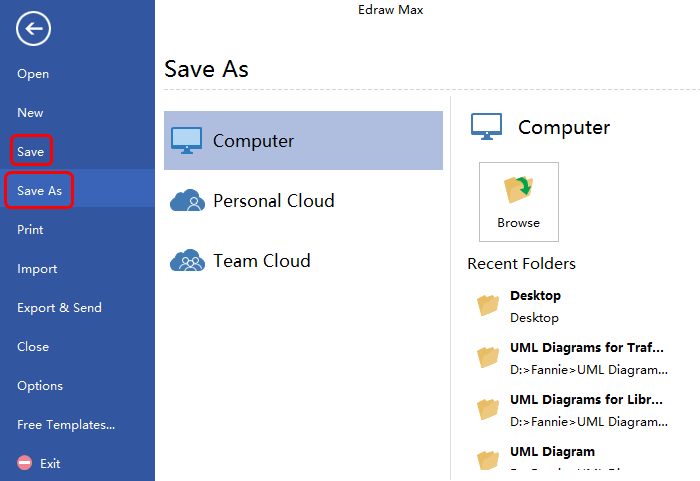
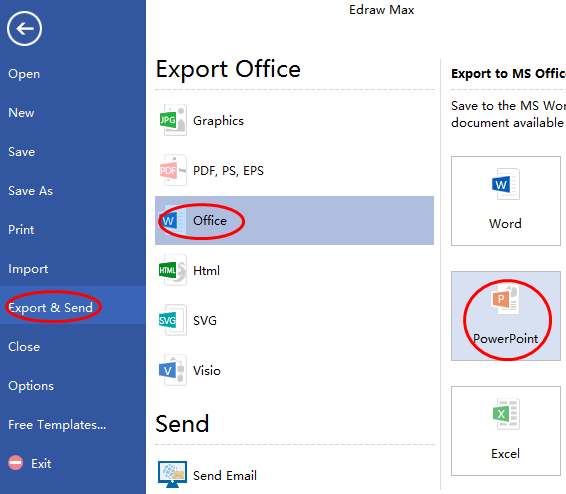
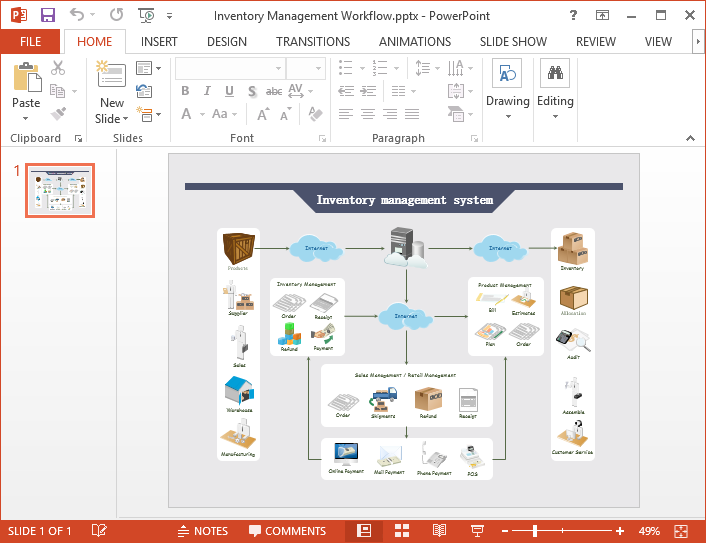
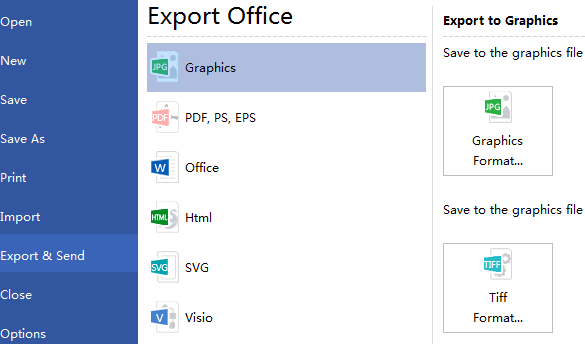
- Click Save on File tab to save as the default .eddx format, or you can also select Export & Send under File to export the decision making flowchart to images, PPT, PDF, Word format.etc.
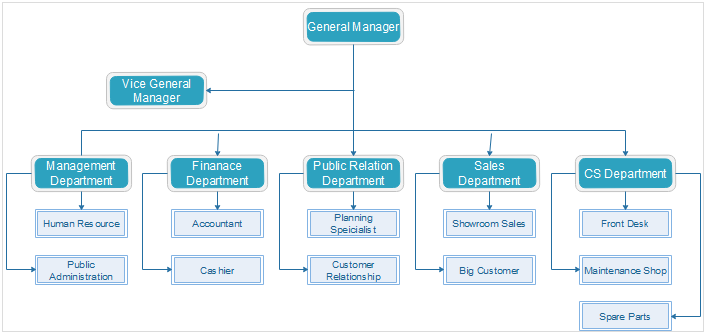
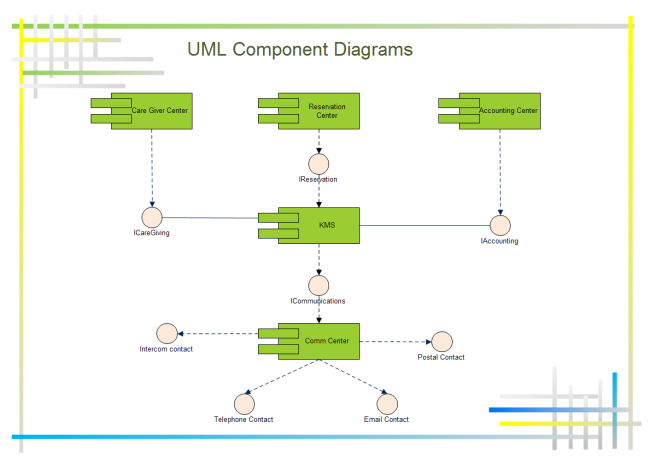
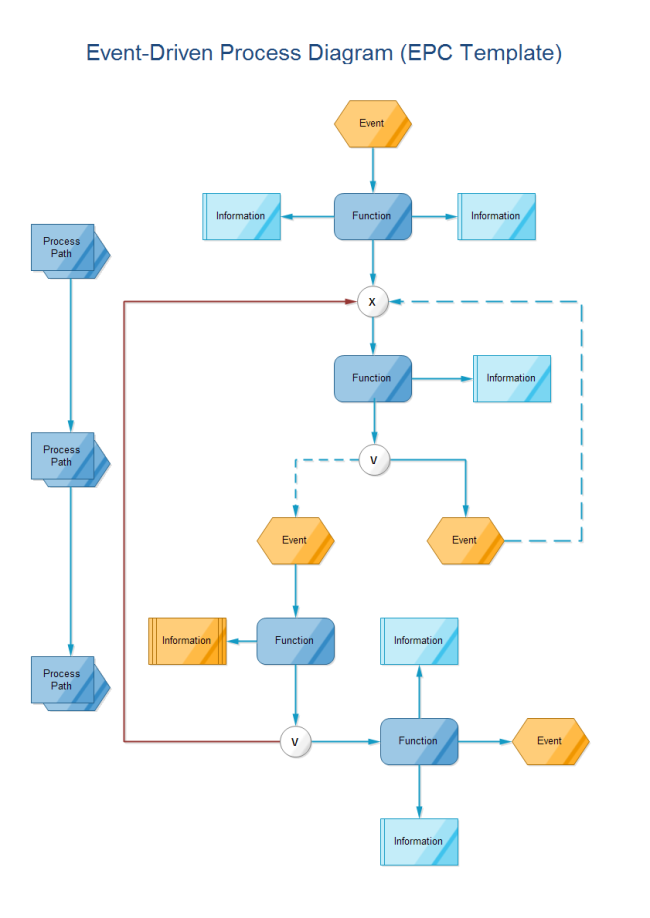
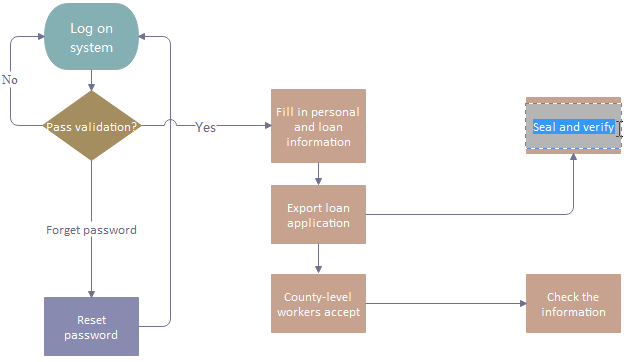
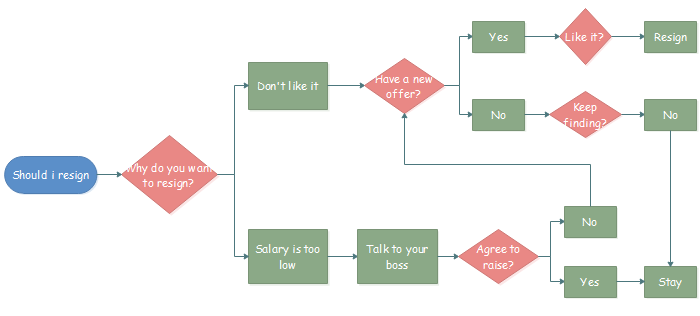
Below is the created business process analysis diagram example.
Software to Create Business Process Analysis Diagram
Flowchart maker has so many handy features which can simplify the flowchart creating process and enabling users to be hands-free, and that’s exactly why so many people choose it to create flowcharts.
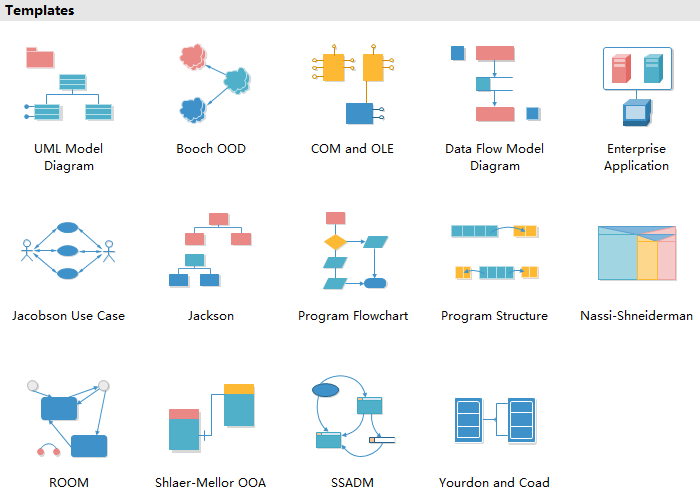
Abundant Pre-made Flowchart Templates
It has hundreds of professionally designed
flowchart templates for you to begin creating quickly. Just choose a template and edit it to suit your needs.
Automatic Formatting
It has smart drawing to let users connect, align and space shapes automatically. Users do not need to set the distance between shapes one by one by themselves, smart drawing will keep them the same.
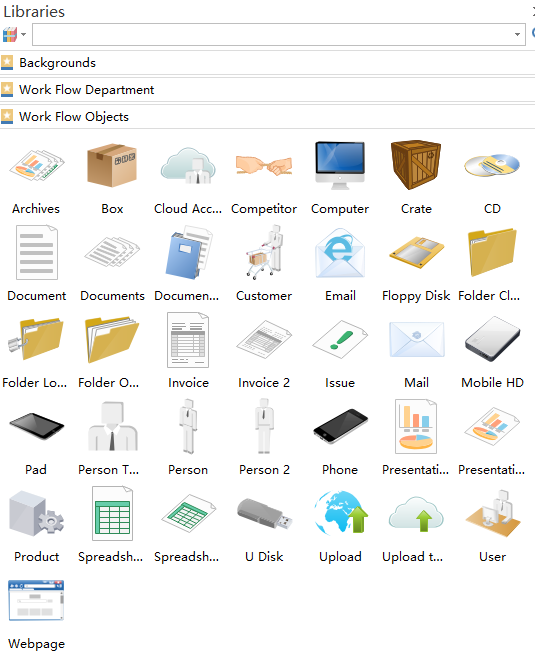
Easy to Start
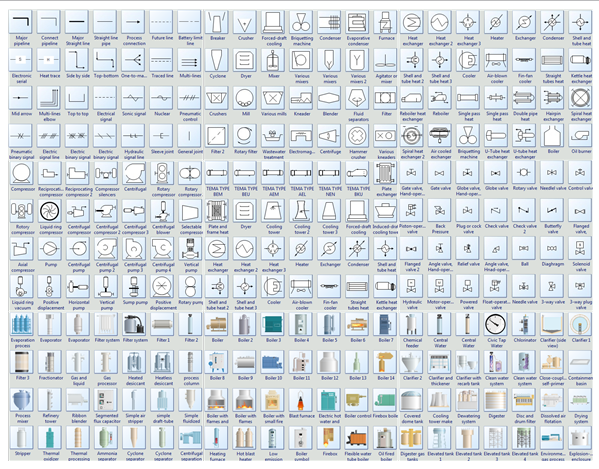
It has a large quantity of built-in
flowchart symbols for drag-and-drop and similar interface with Microsoft help you get started effortlessly, no drawing skills required.
More Business Process Analysis Diagram Types
Except for flowchart, this flowchart maker has many other types of diagrams which can also create business process analysis diagrams.
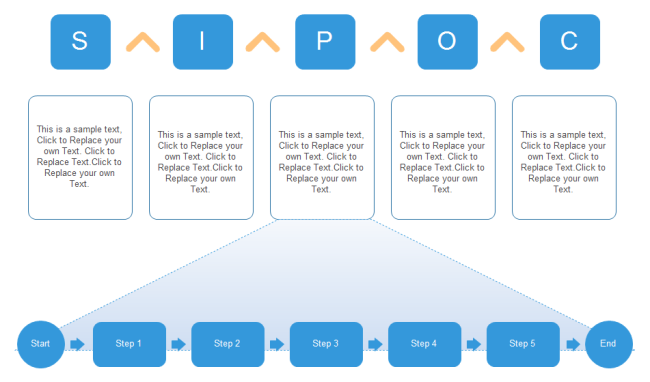
SIPOC Diagram
SIPOC (suppliers, inputs, process, outputs, customers) is a visual tool for documenting a business process from beginning to end. Below is an business process analysis diagram example created by SIPOC diagram.
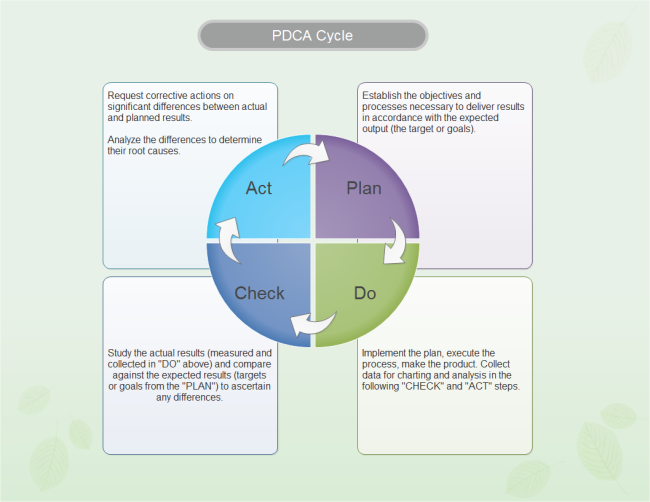
PCDA Cycle
PCDA (plan-do-check-act) is an iterative four-step management method used in business for the control and continual improvement of processes and products. It is also great for creating business process analysis diagrams and here is an example.
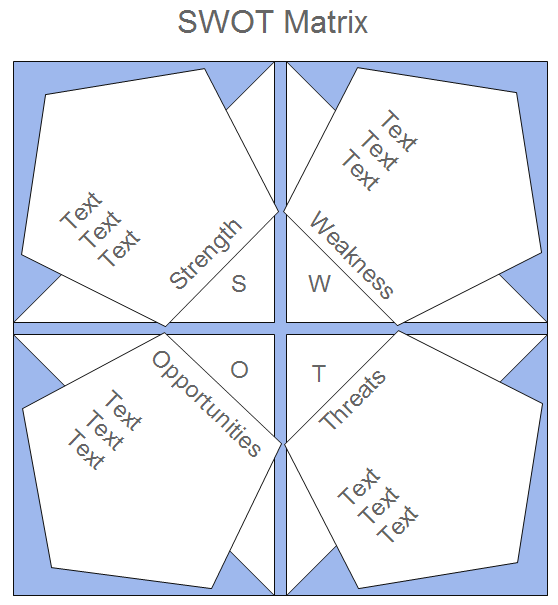
SWOT Analysis
SWOT(strengths, weakness, opportunities, threats) is a structured planning method that evaluates those four elements of a project or business venture. It is a good tool to analyze the strength and weakness of your business process.


 3.Its smart drawing guide enable users to connect, align and space symbols automatically with no need to do those one by one.
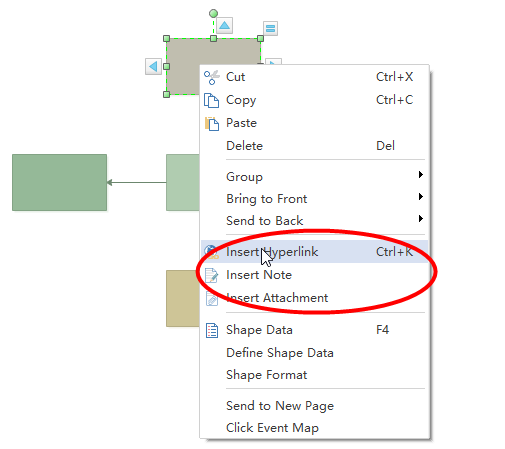
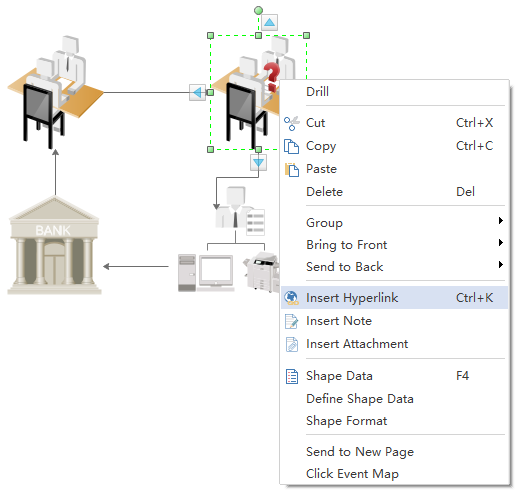
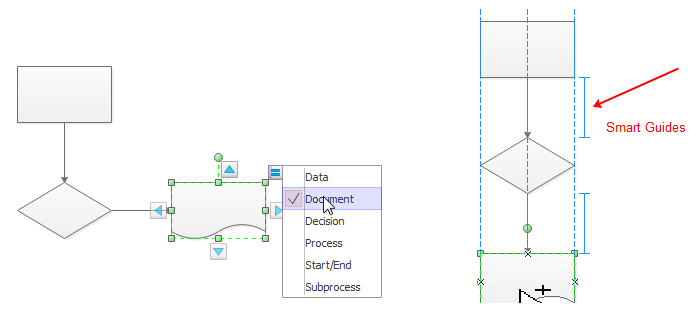 4.It supports inserting hyperlinks, attachments and notes to flowchart, which can make flowchart more resourceful and attractive.