Product development flowchart visually outlines the essential processes of developing a new product, which enables product managers to follow up the project more effectively.
Introduction of Product Development Flowchart
Generally speaking, product development often happens when the characteristics of current products can not meet customers’ demand or can not offer any new or additional benefits to them. It typically includes following four main phases:
- Fuzzy front-end (FFE) is the opening stage of a new product.
- Product design is the process of designing the function and appearance of new product.
- Product implementation refers to the phase of detailed engineering design of product including test process to make sure the product can meet the demand of customers.
- Fuzzy back-end, also named commercialization phase which means launching the new product to the market.
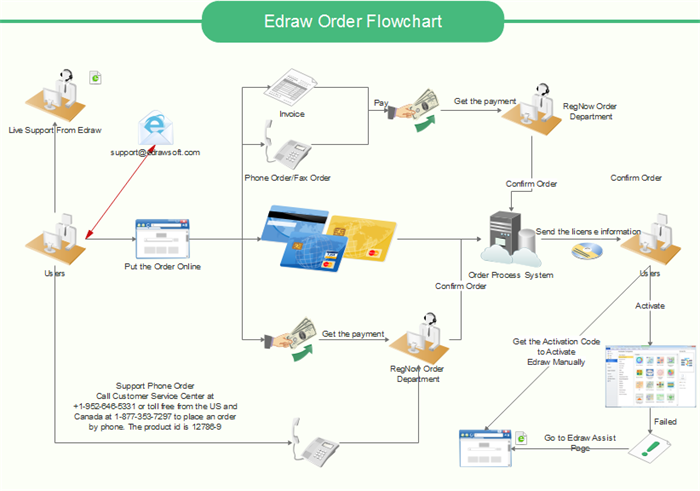
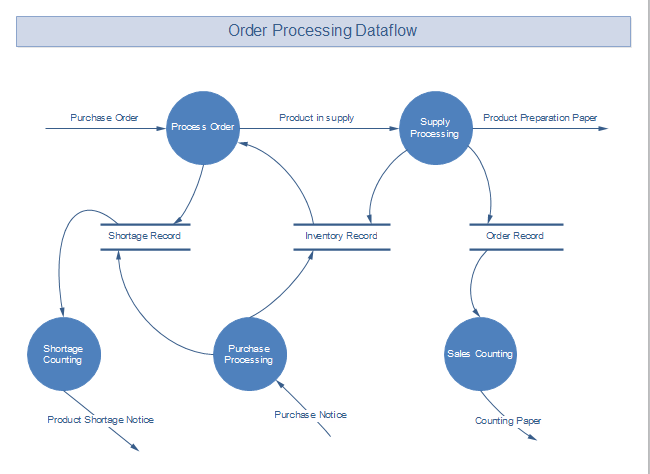
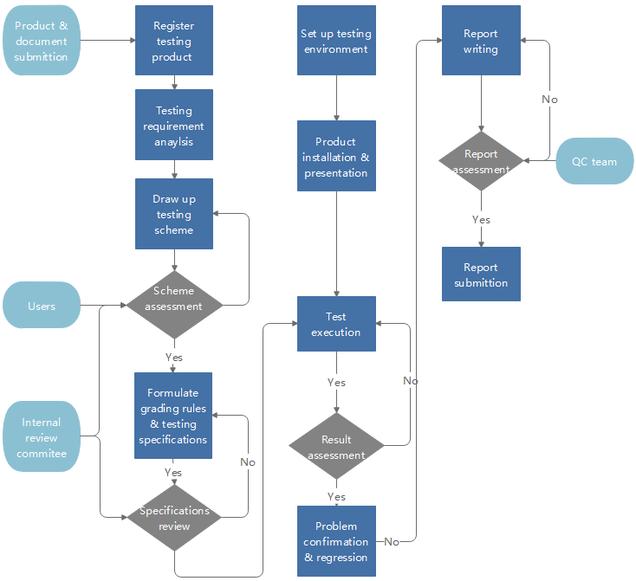
And product development flowchart is a diagram which depicts these phases graphically and easy to follow through.
Steps to Create Product Development Flowchart
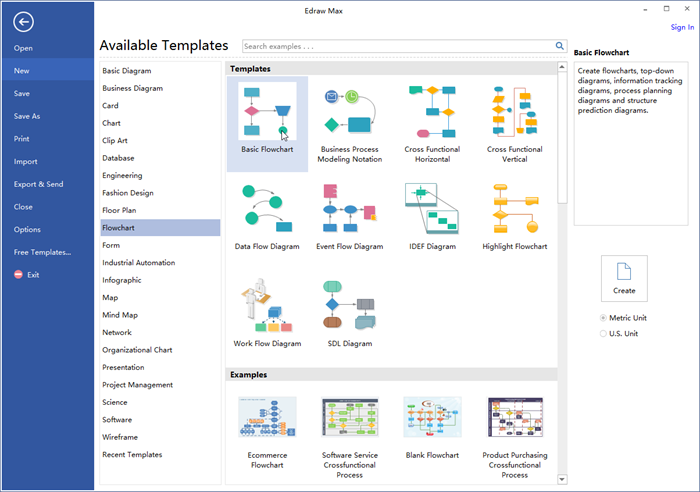
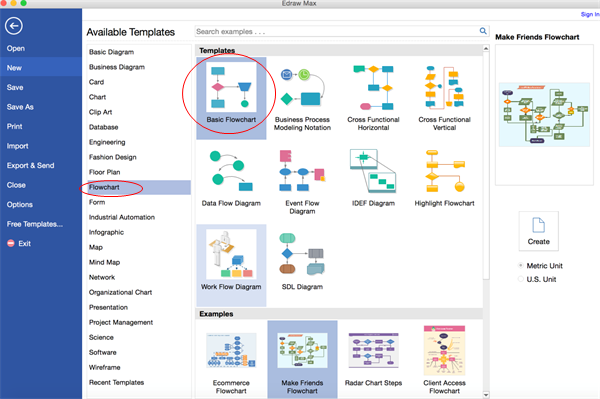
- Run the software, go to the File menu and open a blank drawing page.
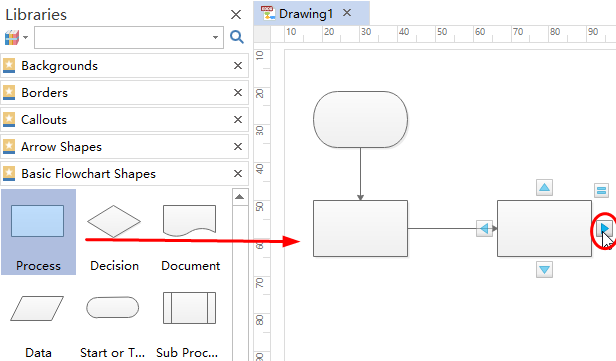
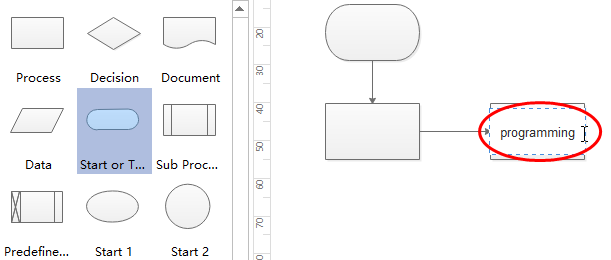
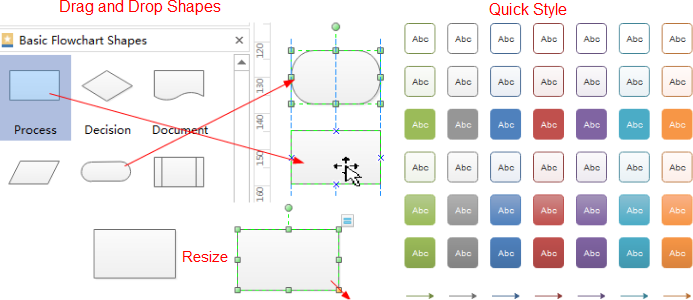
- Drag and drop flowchart symbols from left libraries and double click to type information.
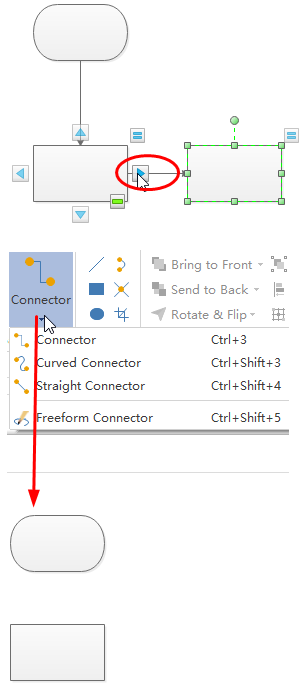
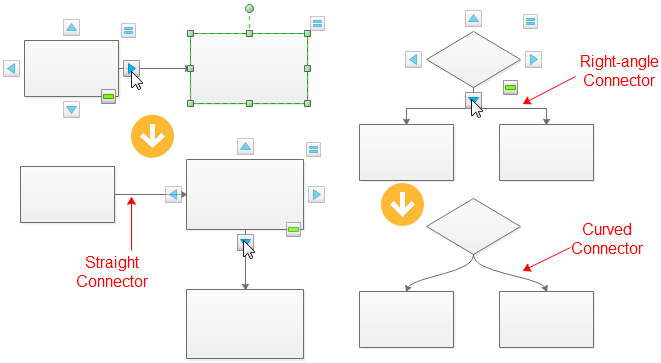
- Click the floating button or choose Connector in the Home page to connect symbols in order.
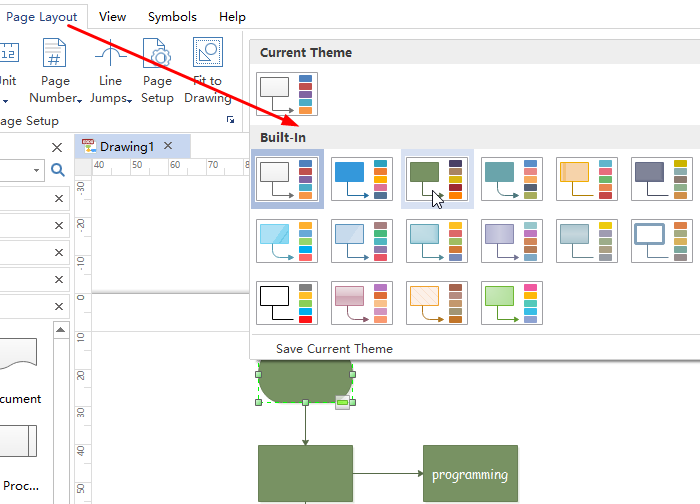
- Navigate to Page Layout and change the theme from built-in themes if you do not like the current one.
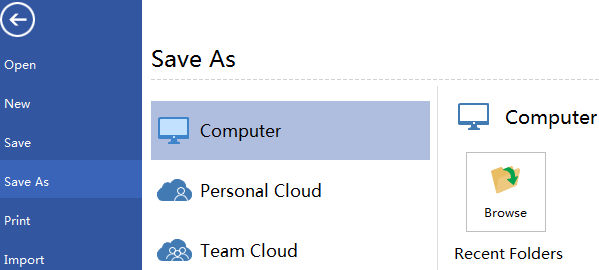
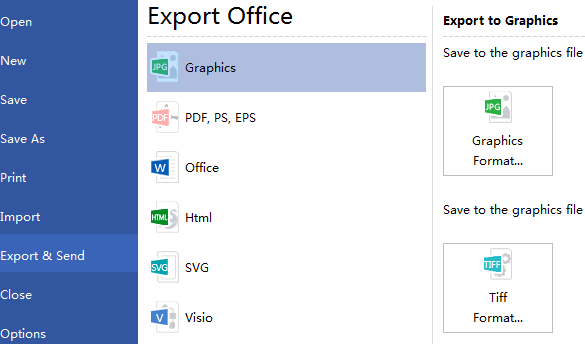
- Go to File menu again and click Save as, then browse your computer and choose a location to save your product development flowchart.
Then you successfully get a professional product development below.
Software to Create Product Development Flowchart
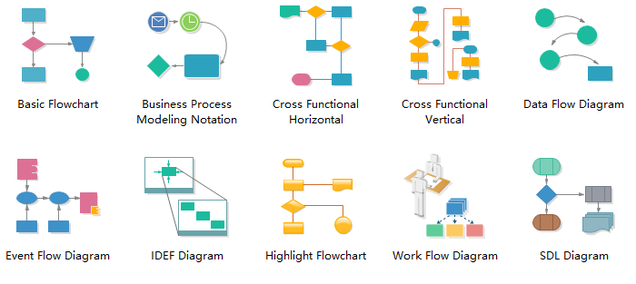
A good flowchart make should be equipped with following handy features.
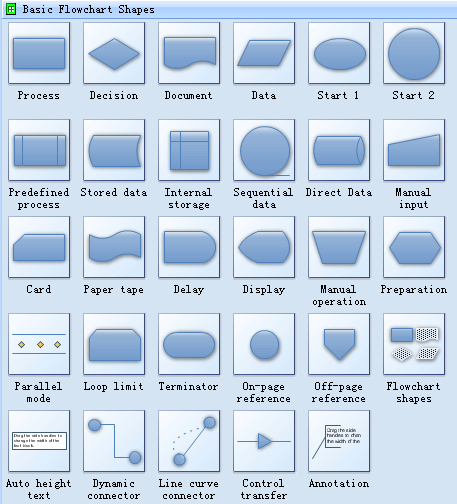
- A large quantity of flowchart shapes are offered for dragging and dropping. No need to draw it by yourselves.
- It provides abundant various flowchart templates and examples for users to download and customize. Simply choose the template that you want, and edit it to fit your needs.
- Smart drawing of it enables users to connect, align and space shapes automatically. Once starting a shape, users can click the floating buttons to finish the rest, which improves the work efficiency dramatically.
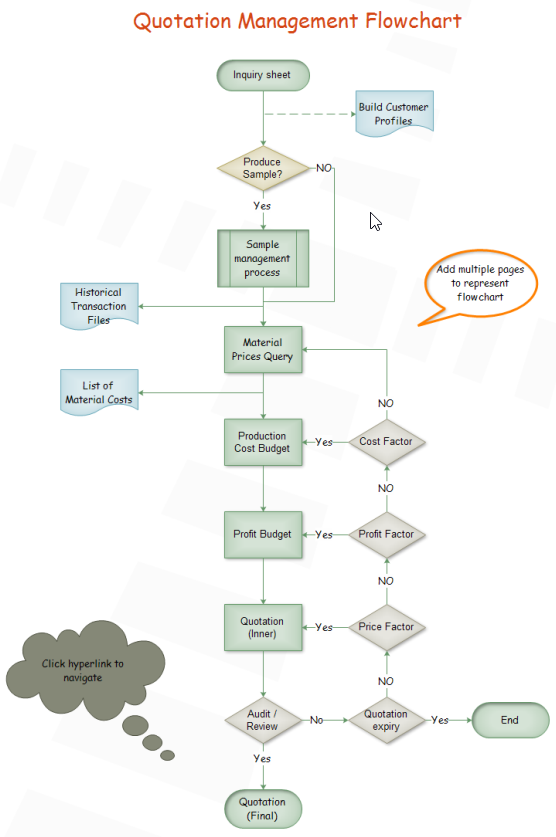
- Users are allowed to insert hyperlinks, attachments and notes to flowchart, which can make it resourceful and enable audience to have a better experience.
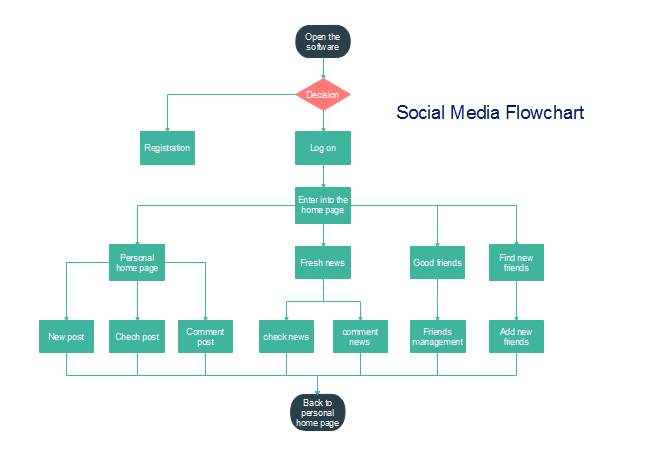
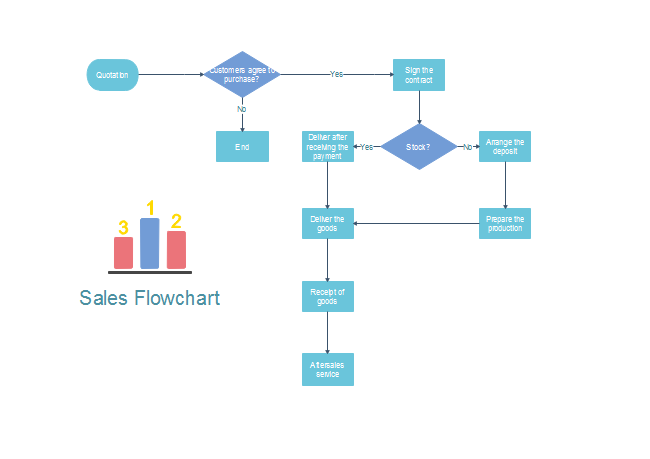
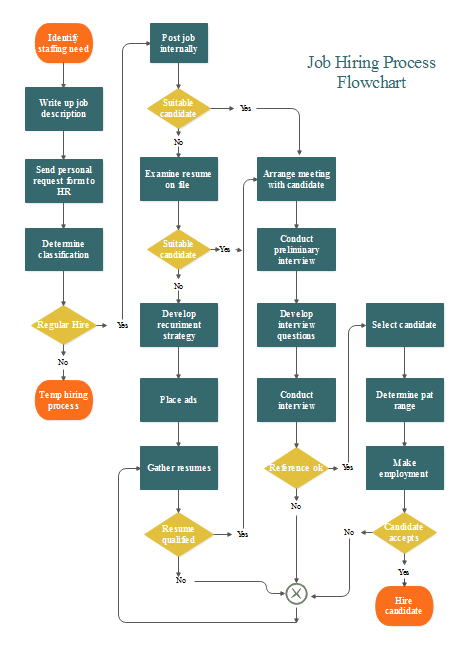
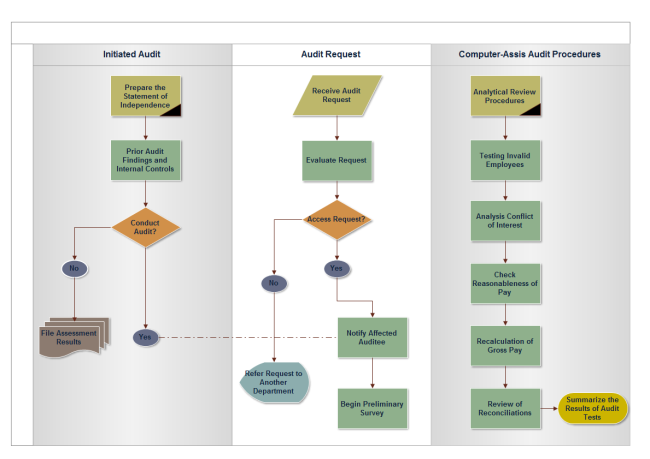
More Flowchart Examples
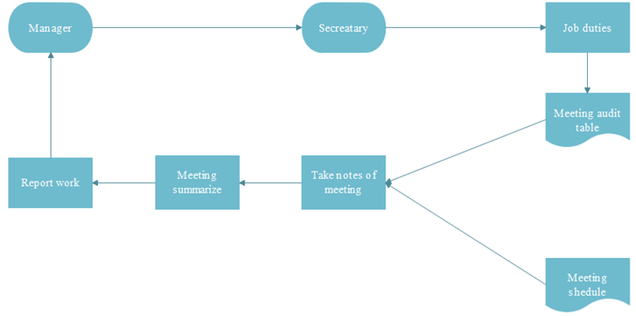
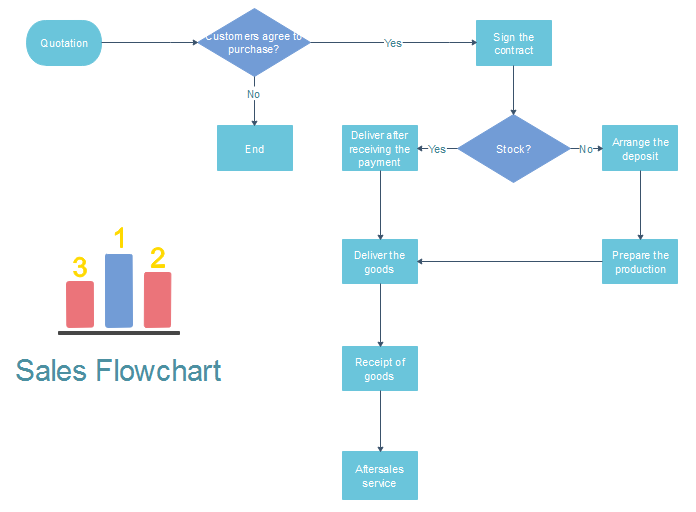
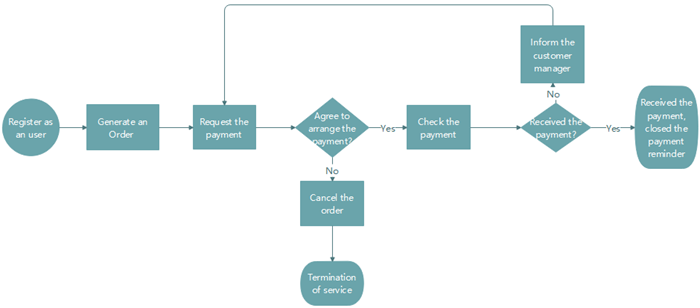
Flowchart Maker is not only professional for creating product development flowchart, but also professional for creating many other types of flowchart, such as sales process flowchart, construction flowchart, job duties flowchart and so on. Click flowchart examples to view more instances if you are interested. And all the examples are customizable and free to download. You can download it and edit it to suit yourself.