2017年4月23日星期日

Environment Infographic Templates - Make Infographic Drawing Easy

A list of environment infographic templates showing how to protect the earth with vivid graphics and charts. The templates are easily editable and with various vector infographic elements that you can use to make professional-looking environmental infographics.
Infographics are the display of information in such a way that they can be easily understood at a glance rather than long boring texts. And infographics play a more and more important role in this information-flooded age because of its visual presentation. Environment infographics are one of the applications, which are key to better understanding some paramount environment topics like resource scarcity global warming, acid rain or ozone depletion, etc.

Environment Infographic Templates

Following are blank environment infographic templates created by our infographic maker. Please feel free to download and edit them if any interest.

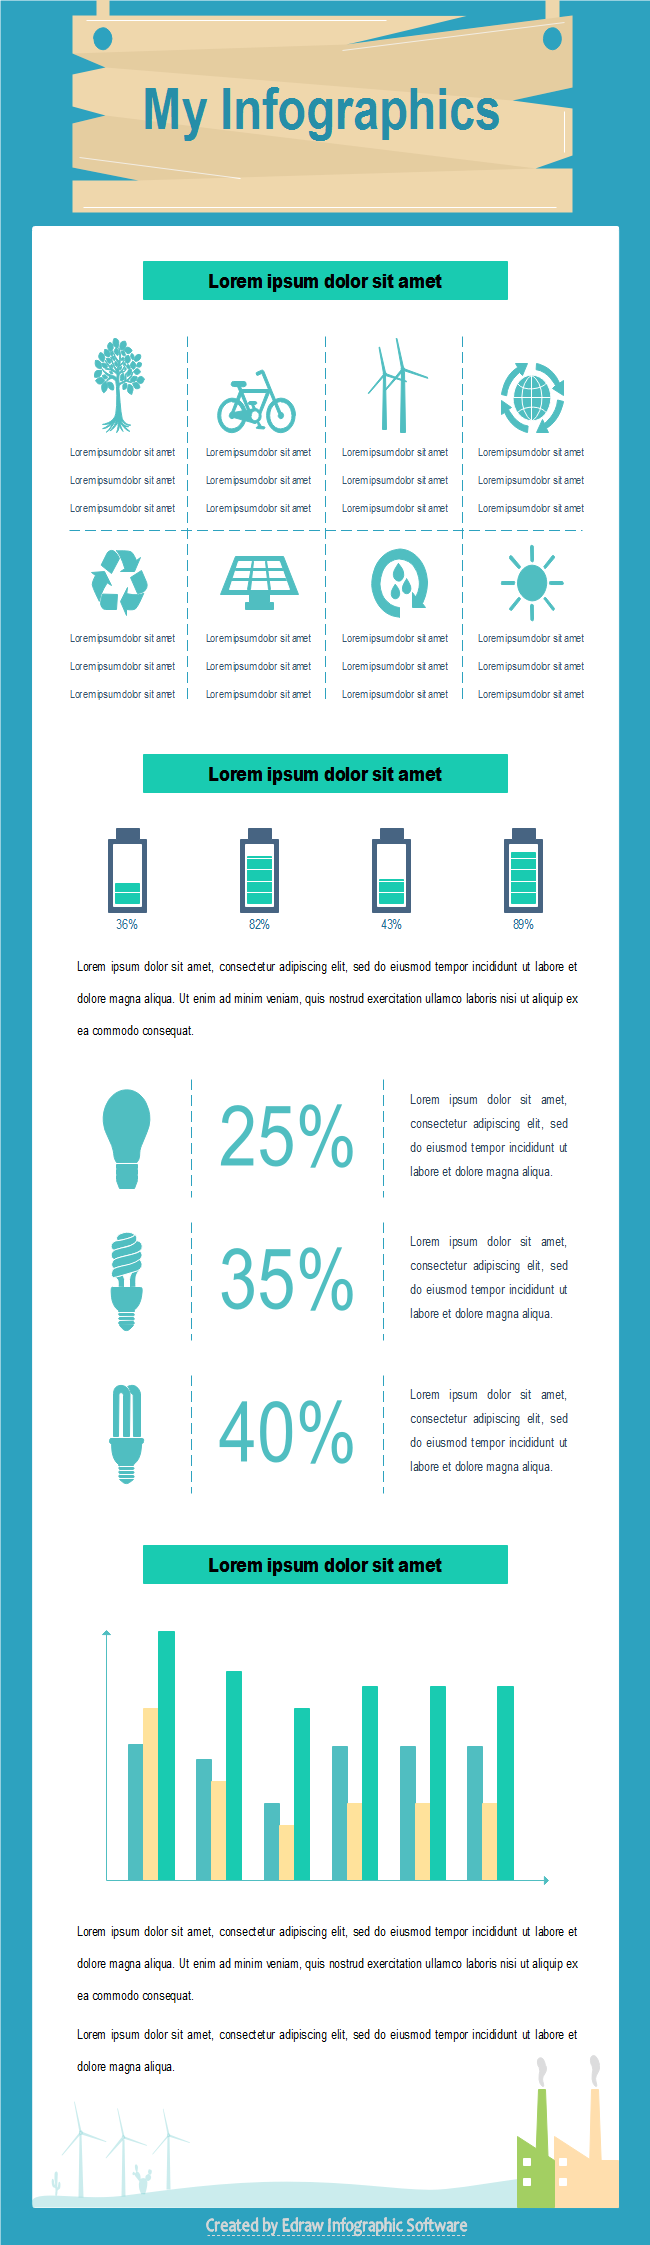
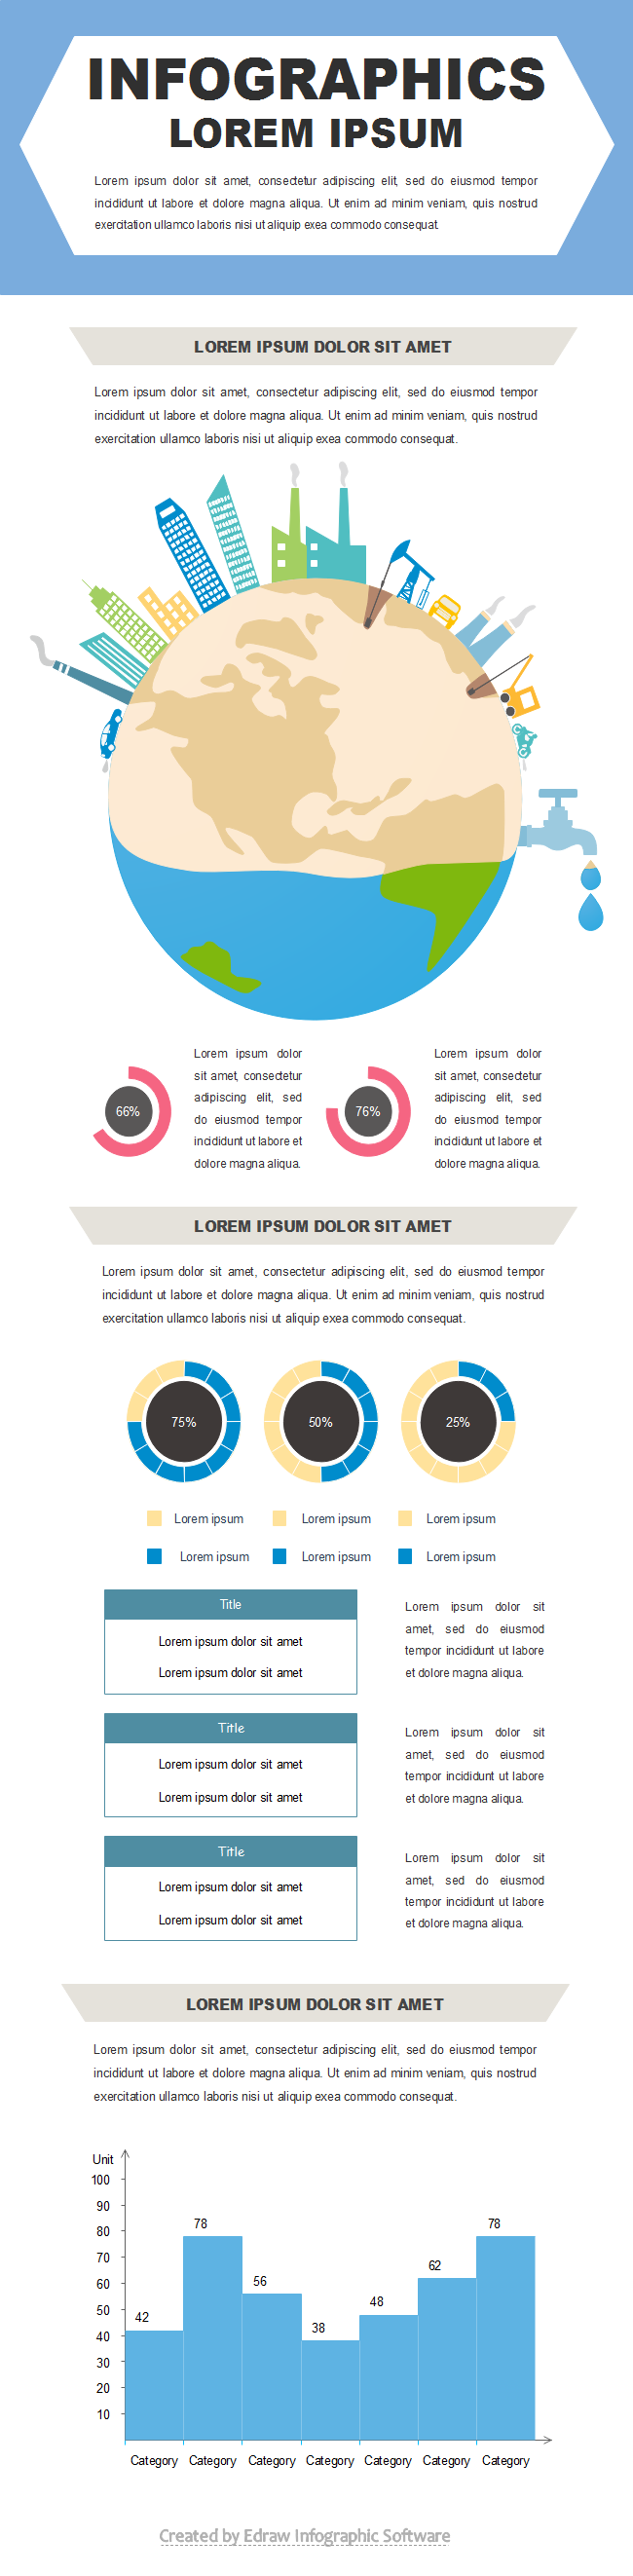
Love Earth Infographic Template

This love earth infographic template shows a polluted planet with excessive factories and traffics. It also includes charts telling people with data how much the earth is damaged, and how urgent we should love and protect our earth.
Environment Infographics Template1

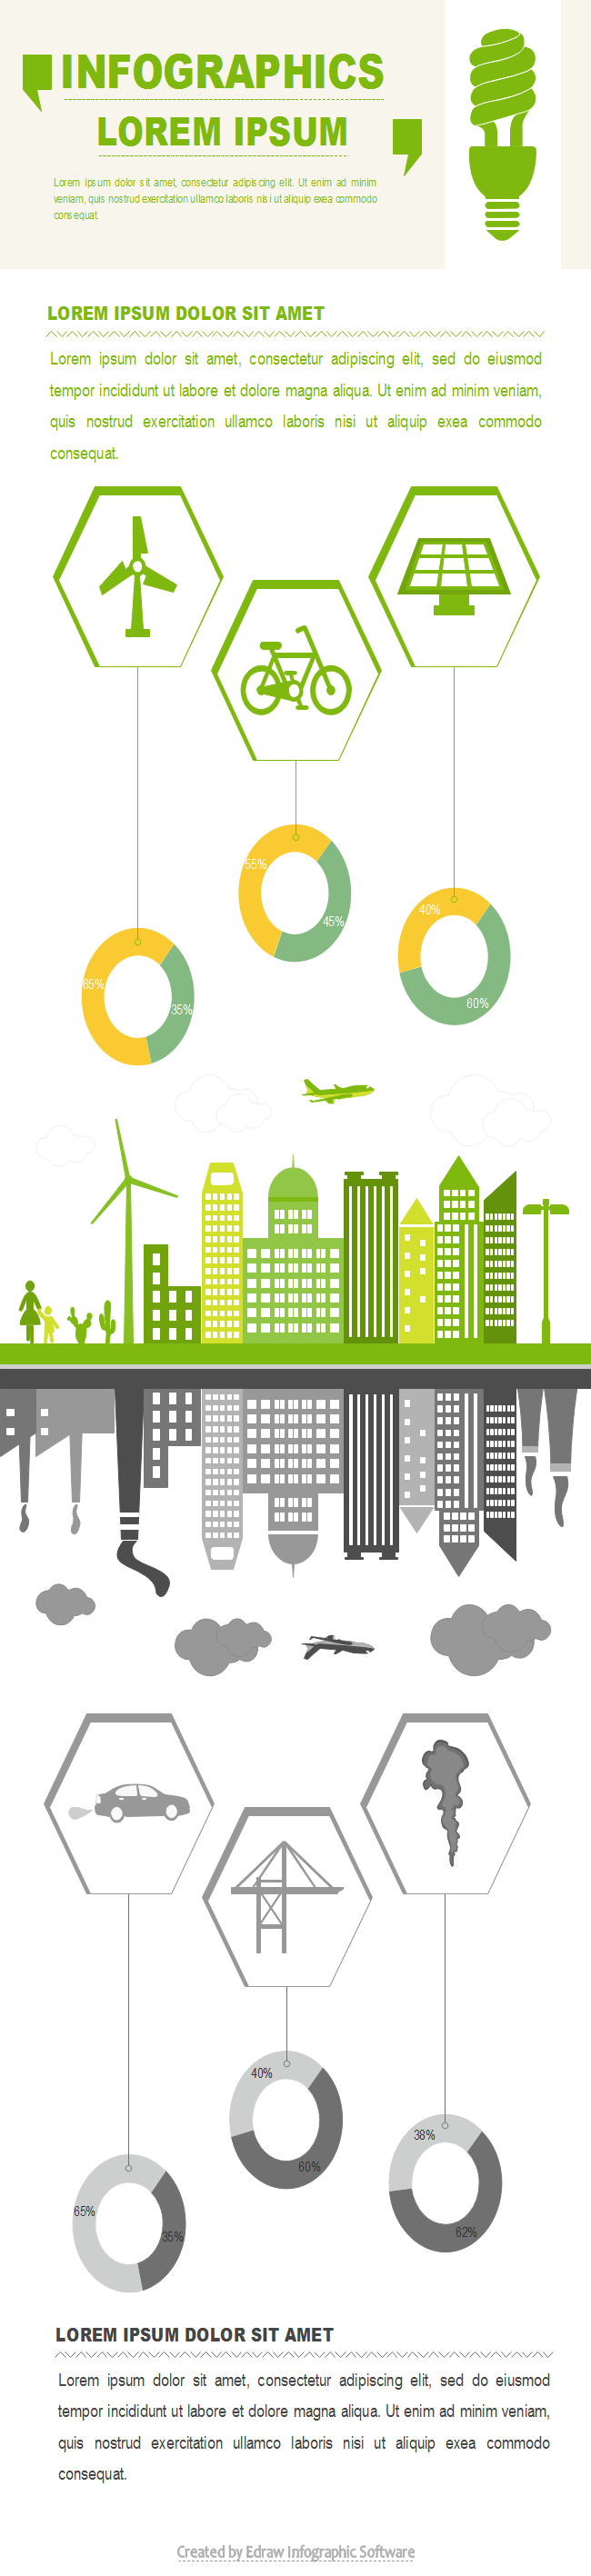
Pollution Warning Infographic Template

Pollution likely affects over a billion people around the world, and it's time we begin and seriously protect and save the environment. Below is a pollution warning infographic template that you can use to educate people to realize the severe environmental situation. It uses green and gray colors to show the contrast of polluted and unpolluted environment.
Environment Infographics Template2

Environmental Care Infographic Template

Environment protection is always an important issue. It's time to take actions to care and love our environment. This envrionmental care infographic template shows what we can do from our daily life to care and protect the earth.
Environment Infographics Template3

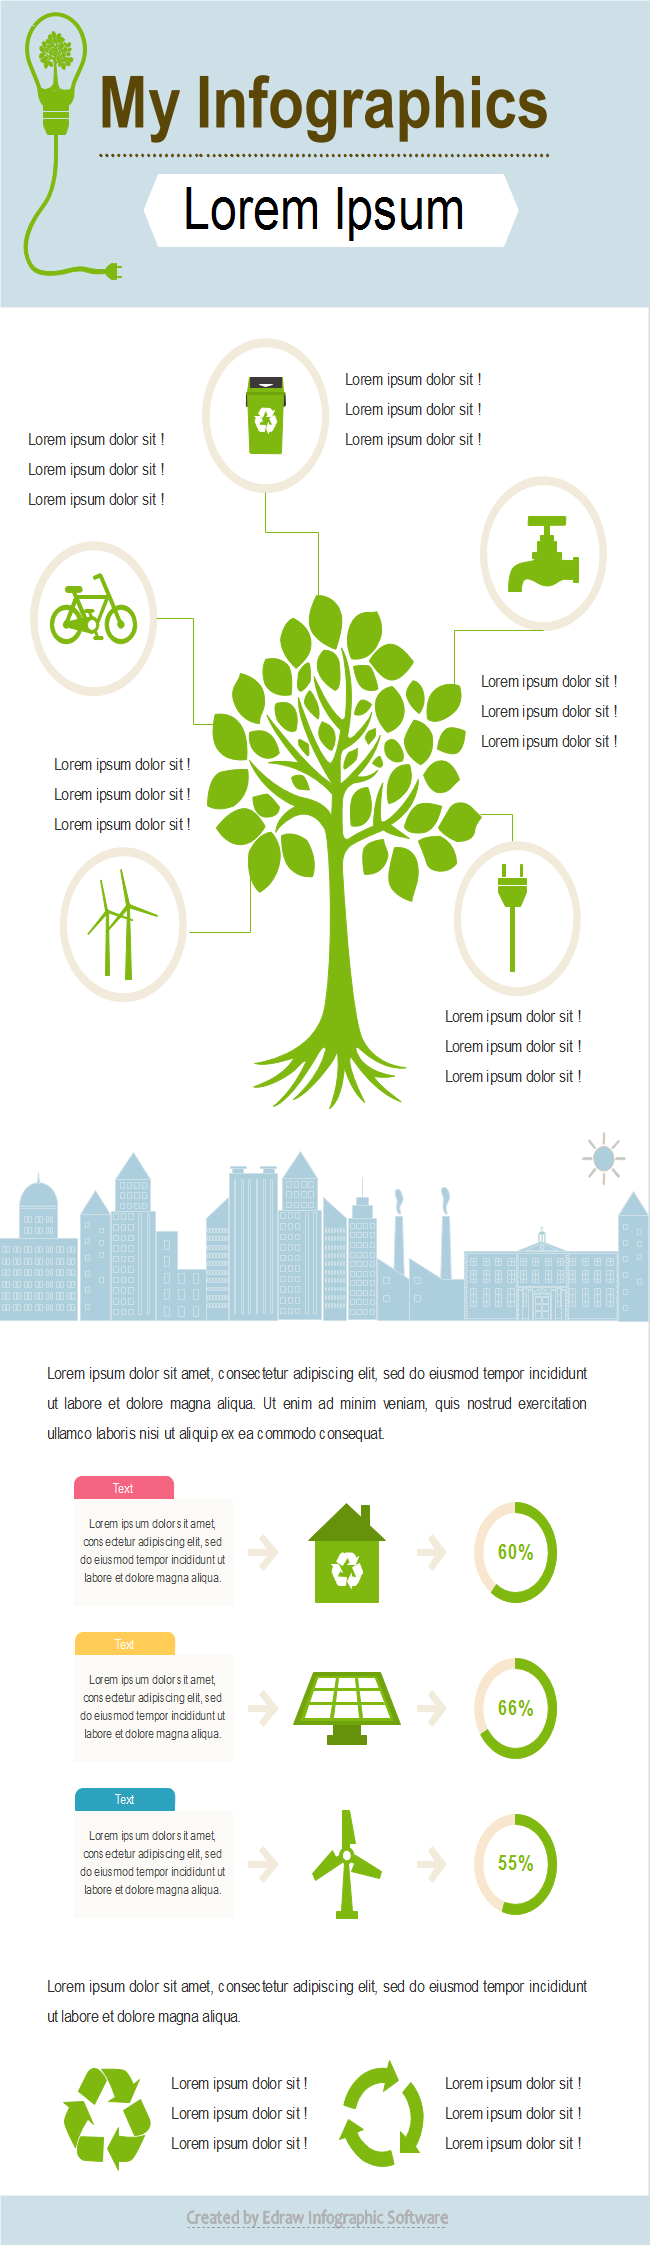
Environment Guide Infographic Template

If you want to tell people what they can do to save the earth, you can use this environment guide infographic template. It gives some advices visually and vividly through the combination of images and texts. The template is fully customizable. You can change the text, color or images with your own.
Environment Infographics Template4

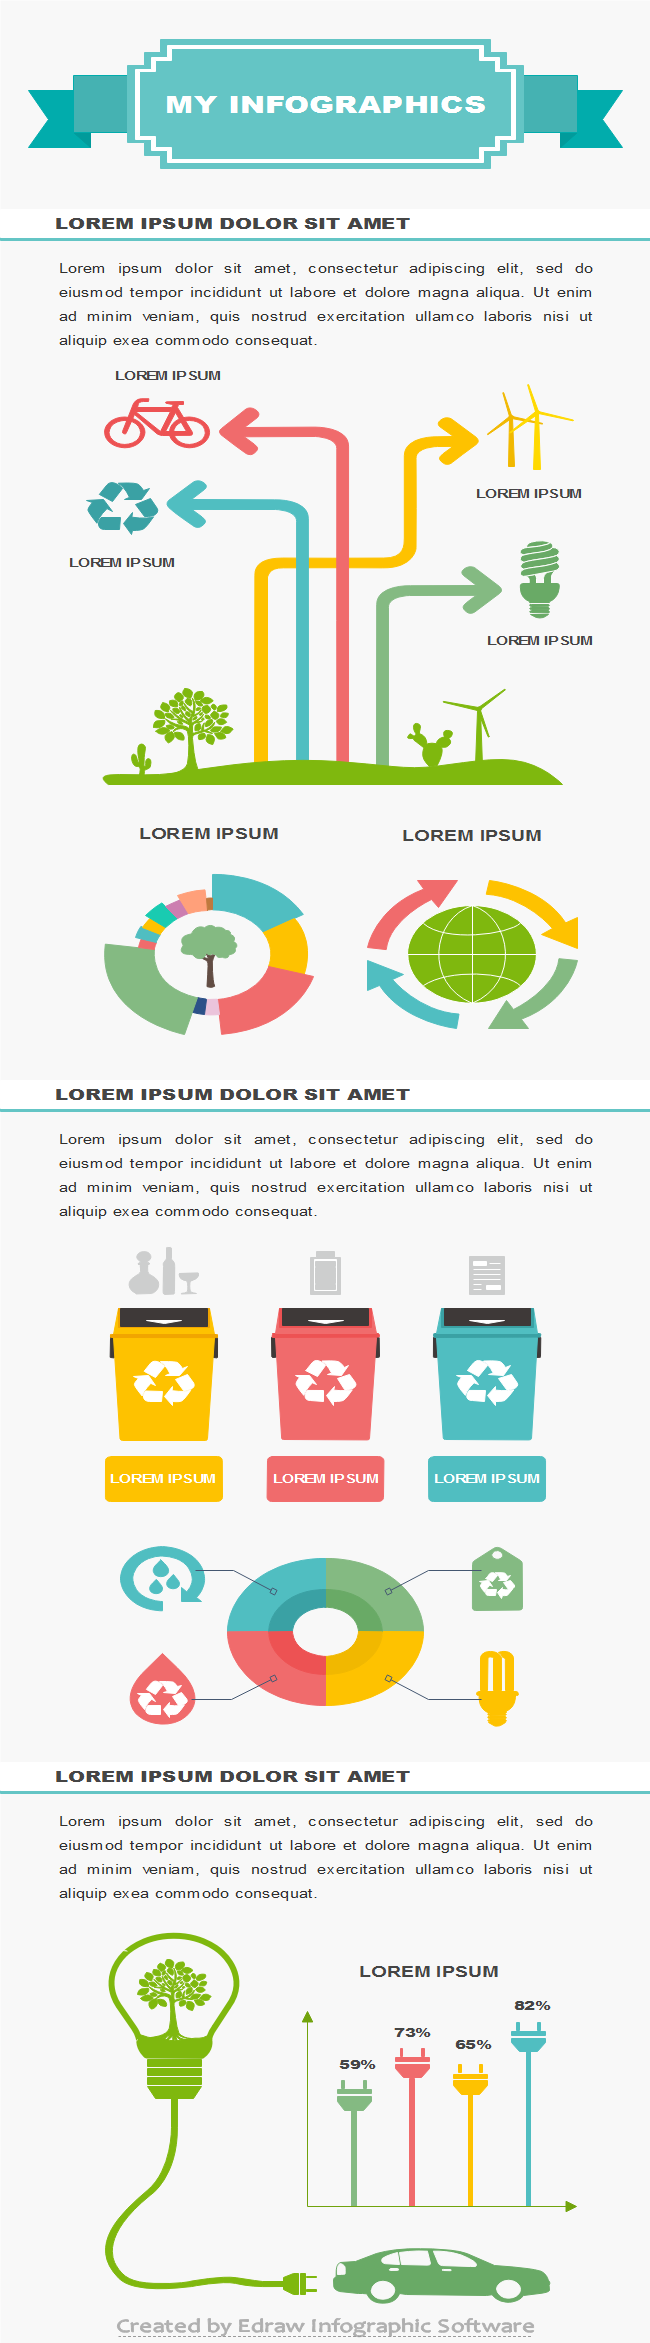
Better Environment Infographic Template

There are many green tips to make our environment better. This better environment infographic template can help you visualize the tips. Click the infographic you can download the editable file and use it to represent all your ideas about environmental protection.
Environment Infographics Template5

2017年4月14日星期五

How to Edit An Existing Infographic Template to Your Needs

A simple guide on how to edit an existing infographic template to your needs and a quick overview of a powerful and humanized infographic maker.

Steps to Edit Existing Infographic Template

Below are detailed steps to edit infographic templates.

Step 1. Open A Template

The first step is launching infographic software, clicking New > Infographic to open a infographic template.
Open An Infographic Template

Step 2. Change the Content

Pitch on the existing content and press Delete Tab to delete them, then adding your own text.
Change Content

Step 3. Replace The Icons

What we are going to do now is replacing the current infographic elements. Just opt for the existing icon and replace it with the icon you drag from the left libraries.
Replace Icons

Step 4. Substitute The Charts

After that, it’s time to delete the existing charts and substitute with your own charts and data.
Substitute Charts

Step 5. Save or Export The Edited Infographic

The newly edited infographic is almost ready after finishing above steps. And now users can click Save on File tab to save the new infographic as the default .eddx format; or users can also choose Export & Send to under File menu to export the infographic to common formats for sharing more conveniently.
Save or Export Edited Infographics
Below is the edited infographic template for your reference.
Edited Infographics

2017年4月10日星期一

How to Design Animal Infographics within Minutes

A simple guide on how to design animal infographics within several minutes will be introduced in the article.
Infographic software is a powerful and professional animal infographic maker which provides a large quantity of infographic elements and hundreds of templates for users to drag-and-drop. Even a newbie without any drawing skills can also create beautiful animal infographics with it. Following is a step-by-step drawing guide.
Animal Infographics

Step 1. Open A New Infographic Drawing Page

Launch infographic software, go to File menu, click New>Infographic to open a blank animal infographics drawing page.
Open Infographic Blank Page

Step 2. Drag and Drop Animal Symbols

Navigate to left libraries, drag proper animal symbols and drop on the drawing page. All the infographic elements if provided are customizable, users can easily edit the dimensions, colors, directions, group/ungroup the symbols to meet the requirement of different situations. And it provides a set of drawing tools for users to create their own symbols if there they are not satisfied with the built-in ones.
Drag and Drop Animal Symbols

Step 3. Add Key Contents

After dragging animal symbols, go to Home Page and click Text or press Ctrl+2 to add key points, then click any blank area or click Select to finish typing.
Add Infographic Content

Step 4. Choose Background

Users can click Background on the Home page to select a single color background or choose texture background from the left libraries.
Choose Background

Step 5. Save or Export Animals Infographics

Users can click Save on File tab to save the animal infographics as the default .eddx format; for sharing conveniently, users can also select Export & Send under File menu to export the infographics to any formats that convenient to share, such as Word, PPT, PDF, images or even Visio is supported.
Save or Export Animal Infographics

2017年3月31日星期五

Essential Infographic Business People Elements in Business Infographics

When creating business infographics, infographic business people elements become one of essential elements definitely which can make the infographics more interesting and professional.
Infographic is one of the best tools that a business can use to start a viral marketing campaign for it turns boring data and facts into attractive visualizations which catches more attentions. And infographic business people elements, a major part in the business infographics, get more and more important.

Infographic Business People Elements

A professional infographic maker should provide many kinds of business people elements and group them into different categories for ready reference, just like the below pictures shows. All the infographic elements are editable, users can customize the elements, such as changing the color, size and directions to meet the requirement of different situations.

Examples of Infographic Business People Elements Application

This part offers 3 examples of business people elements application. The first one usually used for business negotiation, people in blue and in white are represented for different companies.
Business People Element Application
Below example often applied in successful negotiation, with files and contracted signed, people shake their hands for future friendly cooperation.
Infographics Business People Element Application
The third examples shows a whole business process. Different people are responsible for different works and they are conducting a global deal.
Application of Infographics Business People Element

2017年3月30日星期四

How to Visualize Data with Charts and Graphs

How to visualize data with charts and graphs has become a hot question during this information explosion age.
This guide shows you the simple steps of how to use a professional data visualization program to visualize data with charts and graphs.

Necessity to Visualize Data with Charts and Graphs

Visualizing a large amount of complex data with charts and graphs is easier for human brain to process information than poring over large fonts with poor format. And data visualization does a great job more than this. Following are benefits of visualizing data.
  • Visualized data are processed faster by the brain.
  • Visuals are committed to long-term memory easier than text.
  • Visualized data can tell stories vividly.
  • Visualized data can reveal patterns, trends, changes, and correlations clearly.
  • Visualized data can simplify complex information for better understand.
  • Visualized data are more effective than words at changing people’s minds.

How to Visualize Data with Charts and Graphs

Step 1. Be clear about the question you need to answer when creating a visualization.
Step 2. Analyze data and start creating basic data visualization.
Step 3. Interpret data and generate the most informative indicator.
Step 4. Select a right chart or graphic to visualize data. Different charts and graphs are suitable for different situations. Such as columns are suitable for data comparison while lines are used for data distribution.
Step 5. Use color, size, scale, shapes and labels to differentiate the key messages.
Step 6. A large quantity of comprehensive charts and graphs are provided for users start visualize data rapidly.
Visulas Example

Features of Professional Data Visualization Software

Choosing a professional data visualization program makes visualize data with charts and graphics as easy as a pie. Following handy features make this program the exact right software.
  1. Similar user interface with Microsoft Office enables users to get used to it quickly.
  2. Thousands of built-in drag-and-drop symbol make data visualization fast and easy.
  3. Abundant various pre-designed templates for users to download free and customize contents.
  4. Smart drawing of it enables users to connect, align and space shapes automatically.
  5. Users are allowed to insert attachment, notes and even hyperlinks to make flowchart much more resourceful and attractive.
  6. A large quantity of comprehensive charts and graphics are provided for users start visualize data rapidly.

Data Visualization Examples

Following are examples of data visualization drawn by this data visualization program. All the examples are free to download and customizable. Download the examples you like and edit it to suit yourself!


2017年3月28日星期二

How to Create Organizational Chart for Automotive Industry

Choosing org chart creator to create organizational chart for automotive industry saves you much time and energy.
If you're looking for software to create an organizational chart for automotive industry, here's a thought, org chart creator is designed to make you hands free and hard things easy.
The automotive industry is a wide range of companies and organizations involved in designing, developing, manufacturing, marketing, and selling of motor vehicles, some of them are called automakers. It is one of the world's most important economic sectors by revenue.
An organizational chart is the most common graphical depiction of the roles and structure within an organization. It outlines the roles, responsibilities and relationships between individuals within certain organization. It can be used to depict the structure of an organization as a whole, or broken down by department or unit.
Here is the example of automotive industry org chart
Automotive Industry Organizational Chart

Software to Create Organizational Chart for Automotive Industry

Following handy features makes org chart creator become one of the most popular diagram software.
  • A mass of org chart symbols for dragging and dropping.
  • Numerous org chart templates and examples for free downloading and editing.
  • Smart drawing guide connects, aligns and spaces symbols automatically.
  • Support inserting hyperlinks, attachments and notes to org charts.

Steps to Create Organizational Chart for Automotive Industry

Org chart creator is a great assistant which helps you with many things and you just need a few mouse clicks to finish following simple steps.
  1. Get started by launching the software and opening a blank drawing page on the home panel.
  2. Open a municipal organizational chart drawing page
  3. Choose proper org chart symbols from left libraries and drop on the drawing page.
  4. add municipal structure shapes
  5. Double click the symbols to add names, positions and departments, then finish the typing by click any blank area on the page.
  6. Add municipal structure contents
  7. Click Save on File tab to save the organizational chart as the default format .eddx. Or choose Save as on File tab to save as other formats. Save in local files or save in your Cloud is up to yourself.
  8. Save Org Chart

    More Organizational Chart Examples

    Except for creating organizational chart for automotive industry, this org chart creator is also powerful for drawing project org chart, marketing org chart, city org chart, company org chart and so on. If any interest, pls click organizational chart examples to view and download more examples for free.
    Organizational Chart for Marketing
    Organizational Chart for Company
    Family Tree

2017年3月24日星期五

Steps to Create UML Diagrams for Library Management Systems

UML use case diagrams are one of professional uml diagrams for library management systems.
Library management system is an enterprise resource planning system, usually used in public and corporate libraries, academic as well as government libraries, developed to handle basic housekeeping functions of a library. It helps to provide information on any book present in library to the users as well as staff member. It also keeps a track of book issued, returned and added to library.
UML use case diagram is one of uml diagrams which aims to gather requirements of a system, get an outside view of a system, identify internal and external factors influencing the system and show the interacting among the requirements are actors.

Steps to Create UML Diagrams for Library Management Systems

The UML diagram software i usually use is a professional and smart program which enables users to be hands-free and finish following steps with just several clicks.
  1. Run the software, navigate to Software and double click UML model diagram to open a blank drawing page.
  2. Drag relevant UML symbols from left libraries and drop on the drawing page.
  3. Double click the symbols to add information and finish typing by click any blank area on the page.
  4. Drag proper connector from left libraries to connect symbols.
  5. Click Save on File tab to save the diagram as the default format .eddx. Choose Save as on File tab to save as other formats. You can choose to save in local files or save in your Cloud. You can also hit Export & Send under File to export the uml diagram as images, ppt , web documents and so on.
Below is the created UML diagram for library management systems.
UML Diagrams for Library Management Systems

Software to Create UML Use Case Diagram

Good  UML Diagram Software should almost make everything ready and users need not to do too much. And below are incomparable features the software i use equipped with.
It provides a mass of standard UML symbols for users to drag-and-drop and does not require any drawing skills.
UML Symbols
It also offers abundant UML templates for users to download free and edit contents to get a new diagram within several clicks.
UML Templates
It supports inserting data by adding hyperlinks, note, and attachments to make UML diagrams more resourceful and interesting.
UML Data Insertion

2017年3月17日星期五

How to Create PowerPoint Presentation for a Workflow Diagram

Create PowerPoint Presentation for a workflow diagram can be as easy as a pie with a professional workflow diagram creator.
A workflow diagram is a graphical depiction of steps taken, time spent, distance traveled, and other aspects of the way a particular piece of work is done.

Software to Create Workflow Diagram

A good workflow diagram creator should be a diagram program which almost prepares everything for users and that’s why so many people choose it to create their workflow diagrams. Following are part of its handy features.
  • It provides a large quantity of standard workflow symbols for users to drag-and-drop and start drawing quickly.
  • Workflow Diagram Symbols
  • Abundant flowchart templates are offered for free downloading and editing. Just download one you like and customize the contents to meet your different demand.
  • Workflow Diagram Templates
  • Smart drawing guide of it connects, aligns and spaces symbols automatically without doing those one by one.
  • Workflow Smart Drawing Guide
  • It supports inserting hyperlinks, attachments and notes to diagrams, which makes diagrams more resourceful and attractive.
  • Workflow Data Insertion

Steps to Create Workflow Diagram

Creating workflow diagram with this smart workflow diagram creator saves you lots of time and energy since it has already finished almost everything.
  1. Launch the software, go to the File menu and open a blank drawing page.
  2. Drag the workflow shapes you need from left libraries and drop on the drawing page.
  3. Double click shapes to add contents, then click any blank area on the page to finish type.
  4. Connect workflow symbols by clicking floating button around or choosing a proper connector in Connector under Home page.
  5. Click Save under File menu to save your workflow diagram as default format .edxx or choose Save as to save as other formats you prefer.

Create PowerPoint Presentation for a Workflow Diagram

After successfully creating a workflow diagram, creating PowerPoint Presentation for it can be super easy with just a few mouse clicks.
Go to File menu again and click Export&Send, choose Office and click PowerPoint, then browse your computer to find a proper location to save your workflow diagram in PPT format.
Export Workflow Diagram
Here is the created PowerPoint presentation for a workflow Diagram.
Inventory Management Workflow for PowerPoint Presentation

2017年3月13日星期一

Step-by-Step Guide on Creating UML Component Diagram

Simple but effective guideline on how to create UML component diagram quickly.
This is an article which introduces UML component in detailed and gives you a step-by-step tutorial for creating it.

Definition of UML Component Diagram

UML component diagram is a diagram describes how components are wired together to form larger components or software systems. It is often used to illustrate the pieces of software, embedded controllers and some other parts that make up a system and the structure of a it. The main purpose of UML component diagram is to show the structural relationships between the components of a system.

Steps to Create UML Component Diagram

Below is a step-by-step guide to create UML deployment diagram.
  1. Start the UML software you usually use, click Software, then double click UML model diagram to open a blank drawing page.
  2. Drag and drop relevant UML symbols from left libraries or click the floating buttons to add automatically.
  3. Double click the symbols and text the information.
  4. Drag proper connector from left libraries to connect symbols.
  5. Browse your computer and choose a location to save your UML component diagram.
Here is the created UML component diagram example for you
UML Component Diagram

Ideal Software to Create UML Component Diagram

The UML Diagram Software i use frequently have got more and more popularity among people because of its following handy features.
A mass of standard UML component symbols for dragging and dropping. No requirement of drawing skills.
UML Symbols
Abundant UML templates are offered for free downloading and customizing to meet different demands.
UML TemplatesInserting resourceful data is supported by adding hyperlinks, note, and attachments.
UML Data Insertion

Usages of UML Component Diagrams

UML component diagram is a special type of UML diagrams which is used to visualize the static implementation view of a system and describe the organization of the components in a system. Software designers and developer usually use it to model the components of a system, database schema, executables of an application and system’s source code.
  • To model the hardware topology of a system.
  • To model embedded system.
  • To model hardware details for a client/server system and a distributed application.
  • Forward and reverse engineering.