2017年1月12日星期四

How to Create a Sales Process Flowchart

Map out and create a sales process flowchart to help people understand complicated sales process.
Following are some guidelines to help you create a more professional-looking sales process flowchart.

What is a sales process?

In simple terms, a sales process is a systematic process involving a series of steps that enables a sales force to close more deals, make more profits and make more sales through referrals. It mainly includes following steps.
  • Product knowledge is a basic requirement to go on sales process. When a person is extremely versed in a particular product, he has bigger chance to get more orders.
  • Prospecting means searching potential customers in demand. It’s better to create a customer database to record their information for follow-up.
  • Approach means to try many ways to contact the potential buyer. Generally speaking, a telephone call is better than emails, cause many promoting emails enter into junk mail box.
  • After contacting with a customer, you should assess his needs by asking questions.
  • You can make a convincing presentation after you assessing the needs of customer.
  • The final step is as getting an order from customer.
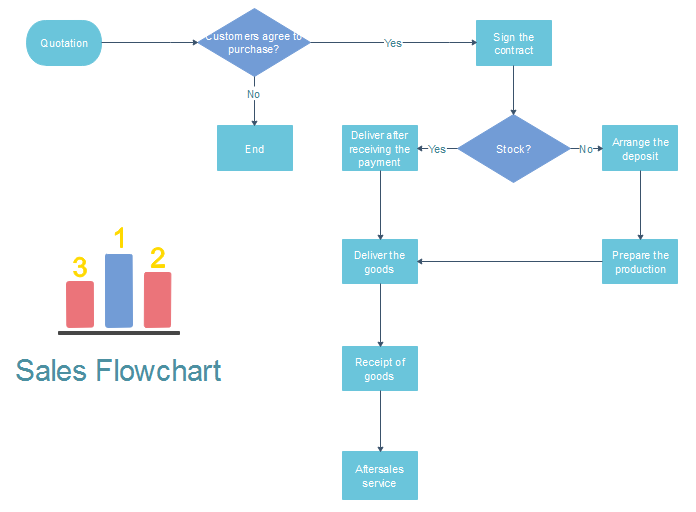
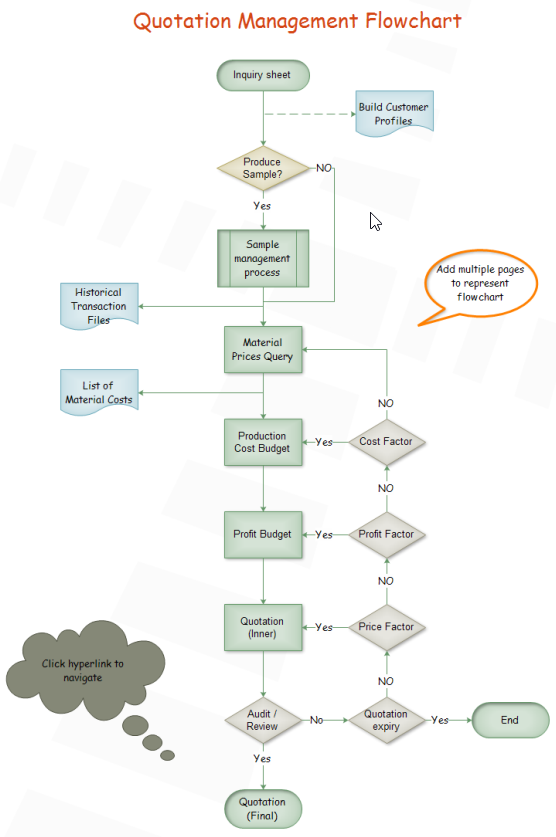
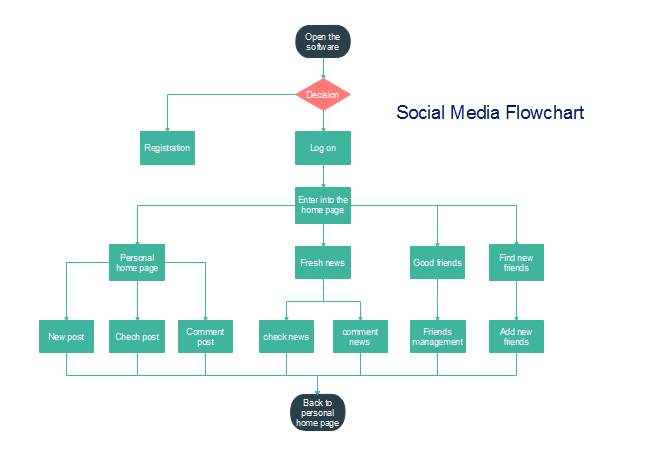
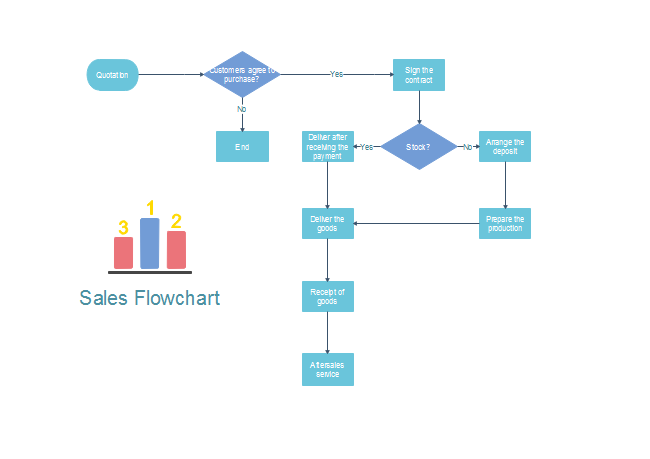
Sales process flowchart aims to make this complex process easy to understand by drawing some symbols and connectors.

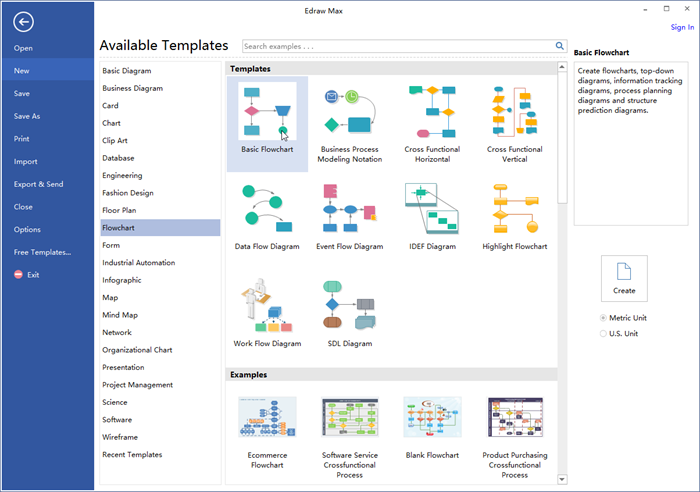
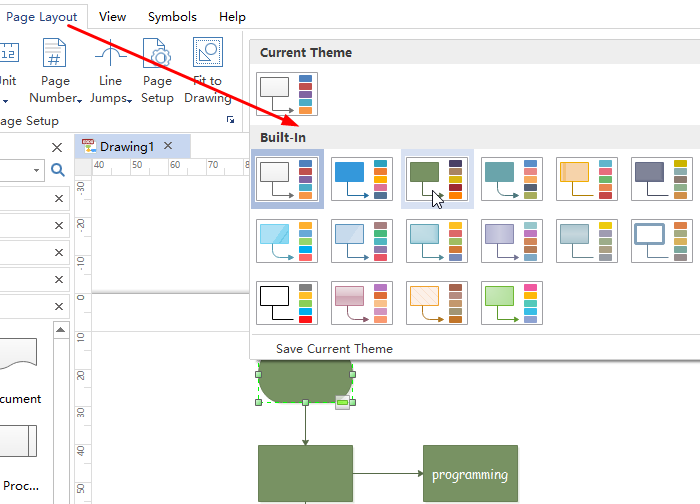
How to Draw a Sales Process Flowchart?

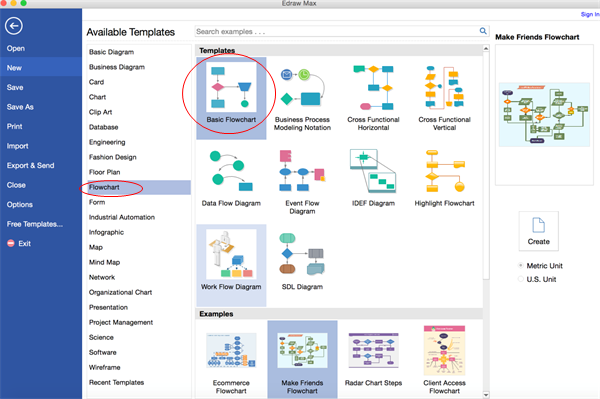
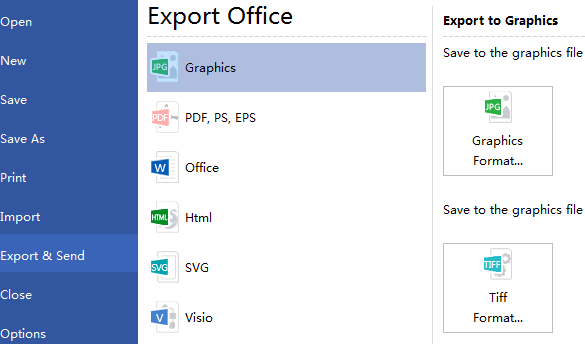
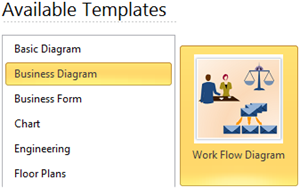
  1. Launch a flowchart maker.
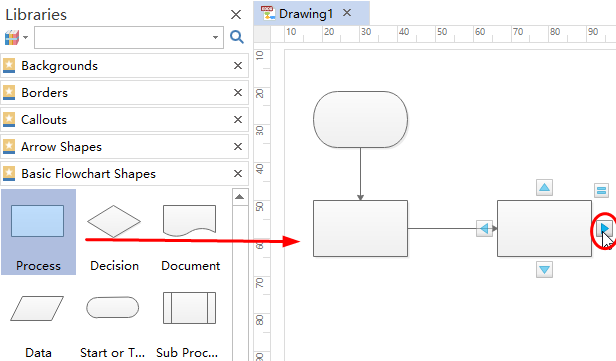
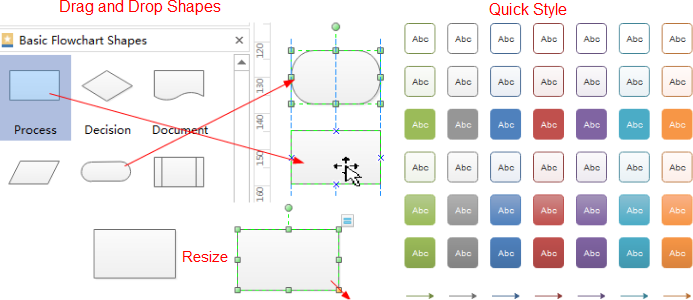
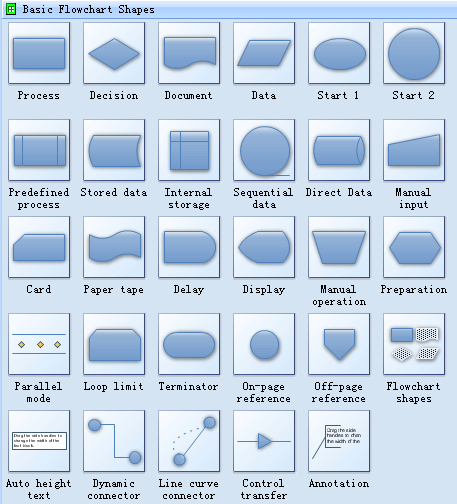
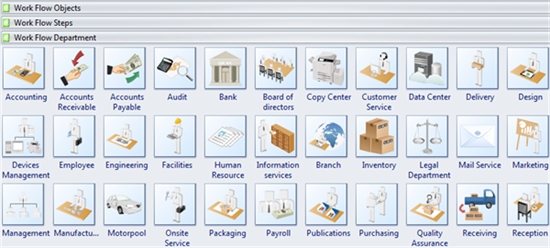
  2. Drag relevant flowchart symbols and drop them on the page.
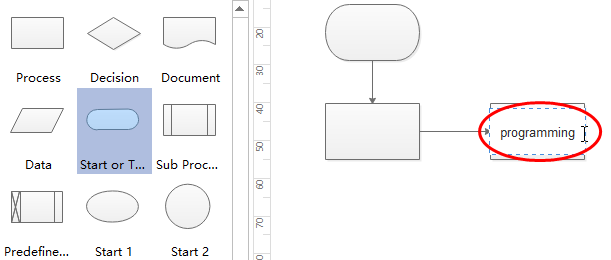
  3. Text steps of the process into right symbols.
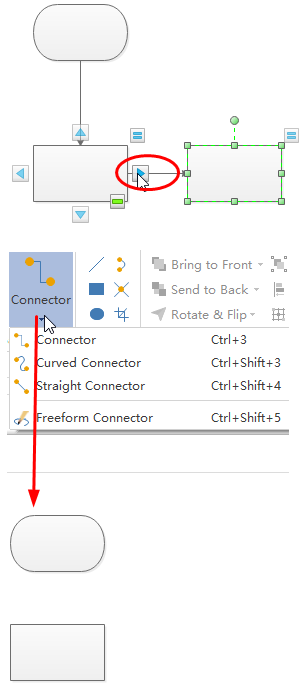
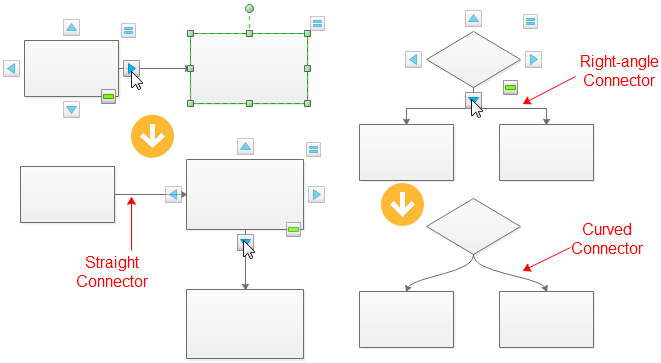
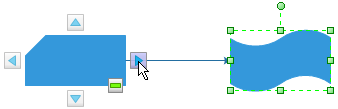
  4. Connect the steps with arrow according to their importance and correct order.
  5. Try to improve sale process flowchart if it needs.
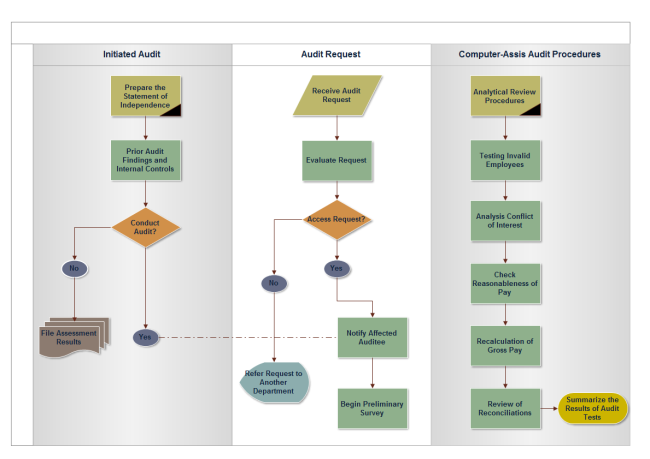
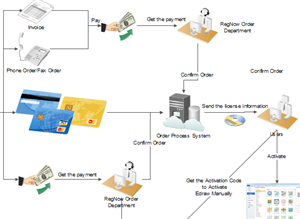
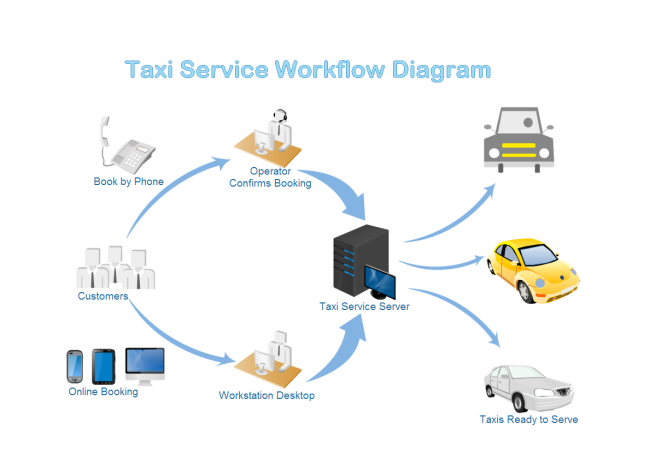
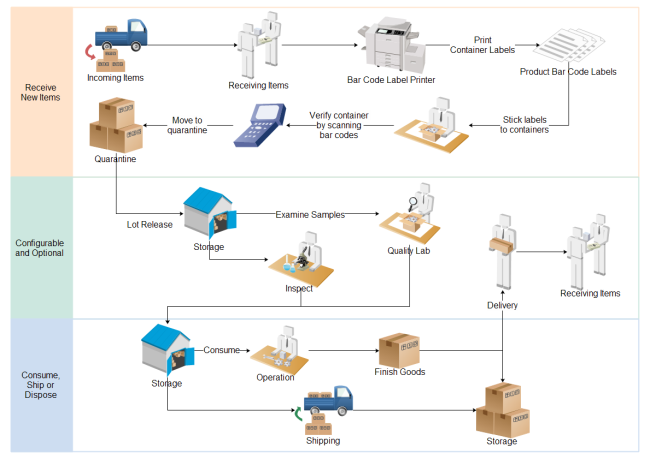
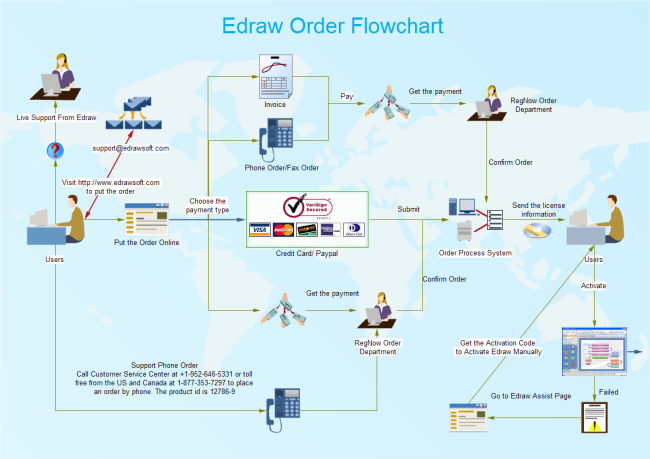
Below is a simple sales process flowchart for your reference. You can understand the whole process easily with this flowchart.
Sales Process Flowchart

2017年1月10日星期二

How to Create a Professional Order Process Flowchart Quickly

Have you ever met with the problem that you do not know what to do and who should be responsible for to process an order? Then you need an order process flowchart to help you have a better understanding about order process.
This article mainly talks about Four parts. The first part is the whole process of order and definition of order process flowchart. The second part is functions of flowchart.The third part is steps to create an order process flowchart. The final part is introduction of professional flowchart software.

Whole Process of Order and Definition of Sales Order Process Flowchart

The whole process of order has 7 steps. Normally start from finding customer in demand, quoting for customer, negotiating price with customer. If the customer is satisfied with the price and quality, he/she will place the order and arrange the payment. Then the supplier prepare the goods and deliver the goods. The whole process of order ends with receipt of goods. Sometimes, there may be repeated orders from customer.
And order process flowchart is a diagram to describe the systematic flow of the whole process from the suppliers to customers and show relationship between the major parts of the process.

Functions of Flowchart

Flowchart is a wonderful tool used to describe complicated ideas or process in a visual and graphical manner. It uses a series of symbols and text to makes complex systems work easily. Flowchart can also help CEOs, general manger and other organization planners to assess the flow of data and make it easier to find the reason if there is something wrong.

Steps to Create an Order Process Flowchart

  1. Find out the staffs or corresponding departments involved in the process or function, and listed them on the page.
  2. List the steps in the process through brainstorming.
  3. Connect the steps with arrow according to their correct order.
  4. Discuss to improve and perfect the flowchart.
With this visual order process flowchart, you can easily understand the whole process of order and know the function of each step. Below is a simple order process example for you.
Order Process Flowchart Software

Order Workflow Chart Example

You can also use graphic representation to show order process instead of using standard flowchart symbols. This kind of flowchart we call it "Workflow". Here is an workflow example of order process.
Order Workflow Example

Order Processing Data Flow Chart

Sometimes developers also would like to use another type of flowchart - data flow diagram. Here is an order processing data flow example. You can click the image to download this template if you need it.
Order Processing Data Flow

2017年1月8日星期日

How to Create a Quotation Flowchart

A quotation flowchart enables sales people know the process of the order and take actions appropriately to close the order with customers.
If you are wondering what is quotation flowchart and how to create it to help you get more orders, follow this article and you will find the answer you want.

Quotation Flowchart Definition

The definition of quotation is telling the cost of goods or service to a potential customer before they commit to the purchase. The price of goods or service are relatively stable once a seller sends a quotation
And quotation flowchart is a diagram which visually depicts the detailed process of quotation from receiving an inquiry to the final closing an order. It lets sales people know how does the order go on and what should they do to proceed the order.

Steps to Create Quotation Flowchart

After knowing the definition of quotation flowchart, it’s time to create it. Drawing a quotation flowchart with a Flowchart Maker is much more effortless than you think.
  1. Run the software and open a blank flowchart drawing page.
  2. Open a Blank Drawing Page
  3. Add flowchart symbols by dragging from the left libraries or click the floating button.
  4. Add Flowchart Symbols
  5. Double click the symbols and text the information.
  6. Add Content
  7. Click the floating button or choose Connector in the Home page to connect the symbols.
  8. Connect Symbols
  9. Click Page Layout and choose the theme from built-in themes if you do not like the current one.
  10. Change the Theme
  11. Browse your computer and choose a location to save your quotation flowchart.
  12. Save Programming Flowchart
Here is a quotation flowchart example for you.
Quotation Flowchart

More Flowchart Examples

Except for quotation flowchart, Edraw Flowchart Maker can also create many other flowcharts, such as social media flowchartsales process flowchartconstruction flowchart and so on. Click flowchart examples to view and download more examples if you are interested.
Social Media Flowchart
Sales Process Flowchart
Job Hiring Flowchart

2017年1月4日星期三

Quick Steps to Create Employee Performance Evaluation Flowchart

Employee performance evaluation flowchart is a great tool not only for employers to evaluate the contributions employees made to companies and but also for employees to improve their performance according to the evaluation criteria during the process.

Introduction of Employee Performance Evaluation Flowchart

Employee performance evaluation, which provides employers with a chance to assess their employees’contributions to the company, is not only essential to developing a powerful work team, but also is a key component for employees’ development. The employee performance evaluation flowchart process includes setting goals, measuring performance, performance feedback, employee recognition and documentation of employee progress.
Employee performance evaluation flowchart uses standard symbols to present the whole process graphically and understandably, both employers and employees can make use of it to meet their own needs.
Quick Steps to Create Employee Performance Evaluation Flowchart - Image 1

Steps to Create Employee Performance Evaluation Flowchart

Follow these simple 5 steps, and you will find creating flowchart with a professional flowchart maker is such an effortless and interesting thing.

Step One: open a flowchart drawing page

On the File menu, go to New >Flowchart, and then double click Basic Flowchart to pen a blank drawing page for designing an employee performance evaluation flowchart.
Quick Steps to Create Employee Performance Evaluation Flowchart - Image 2

Step Two: add flowchart shapes to the diagram from library

Library on the left panel of the program contains all flowchart shapes needed to make a performance management flowchart, simply drag and drop them onto your drawing page.
Tips: you can change a shape’s color and border by clicking any style under the Home tab in the Styles group.
Quick Steps to Create Employee Performance Evaluation Flowchart - Image 3

Step Three: connect flowchart shapes

Shapes are connected automatically by clicking the floating action button to generate connectors between two shapes.
Tips: if two shapes are aligned, a straight connector is generated. If not, a right-angle connector will appear. -> Right click a connector to change its style.
Quick Steps to Create Employee Performance Evaluation Flowchart - Image 4
You can also use Connector tool under Home tab to connect shapes manually.

Step Four: add flowchart contents

To add text content to a shape or connector, double click it, and then type. Click on any blank area of the page to finish typing. After that, you have completed an evaluation flowchart.

Step Five: save or export completed employee performance evaluation flowchart

Click Save on File tab to save as the default .eddx format, or you can also select Export & Send under File to export the flowchart to images, PPT, PDF, Word format, etc even Visio format.
Quick Steps to Create Employee Performance Evaluation Flowchart - Image 5

2017年1月2日星期一

How to Create Flowchart Using Flowchart Symbols

An easy way on how to create flowchart using flowchart symbols will be introduced in following article.

Standard Flowchart Symbols and Their Usage

Standard Flowchart Symbols and Their Usage
Flowcharts generally add symbols, such as connectors, rounded box, circle, etc together, which are usually used to represent how a process works, showing, at a minimum, the sequence of steps.
  • Rounded box - is used to represent an event which occurs automatically.
  • Rectangle or box - most frequently used symbol, represents an event that is controlled within the process.
  • Diamond - shows a decision point in the process. Generally, the statement in the symbol will require a `yes' or `no' response and branch to different parts of the flowchart accordingly.
  • Circle - demonstrates a point at which the flowchart connects with another process.

Create Flowcharts Using Flowchart Symbols

Step One: open a flowchart template
Go to File menu > New >Flowchart, and then double click Basic Flowchart to pen a blank drawing page for creating a flowchart.
Open Flowchart Drawing Page
Step Two: add flowchart shapes to the diagram from library
Library on the left panel of the program covers all flowchart shapes needed to design a flowchart, simply drag and drop them onto your drawing page.
Tips: you can change a shape's color and border by clicking any style under the Home tab in the Styles group.
add flowchart shapes to the diagram

Step Three: connect flowchart shapes
Shapes are connected automatically by clicking the floating action button to generate connectors between two shapes.
Tips: if two shapes are aligned, a straight connector is generated. If not, a right-angle connector will appear. -> Right click a connector to change its style. You can also use <strong>Connector</strong> tool under <strong>Home</strong> tab to connect shapes manually.
Connect diagram Shapes
Step Four: add flowchart contents
To add text content to a shape or connector, double click it, and then type. Click on any blank area of the page to finish typing. After that, you have completed a flowchart. 
complete an Audit Flowchart
Step Five: save or export completed flowchart
Click Save on File tab to save as the default .eddx format, or you can also select Export & Send under File to export the audit flow chart to images, PPT, PDF, Word format .etc.
Export Audit Flowchart

2016年12月29日星期四

How to Create an Audit Flowchart

Financial audit, as an objective evaluation of an organization's financial reports and financial reporting processes, is usually carried out by experts who are working on the financial statements. Owing to its crystal clear structure, it is also widely-used for representing an audit process.
Flowchart, a type of diagram that represents an algorithm, workflow or process, showing the steps as boxes of various kinds, and their order by connecting them with arrows. Therefore, flowcharts are often used in auditors’ activity.
Following tutorial will show you how to create an audit flowchart effortlessly and efficiently.

Step One: open a flowchart template

Launch the flowchart maker, on the File menu, go to New >Flowchart, and then double click Basic Flowchart to pen a blank drawing page for creating an audit flowchart.
Open Flowchart Drawing Page

Step Two: add flowchart shapes to the diagram from library

Library on the left panel of the program covers all flowchart shapes needed to draw an audit process flowchart, simply drag and drop them onto your drawing page.
Tips: you can change a shape's color and border by clicking any style under the Home tab in the Styles group.
add audit flowchart shapes to the diagram

Step Three: connect flowchart shapes

Shapes are connected automatically by clicking the floating action button to generate connectors between two shapes.
Tips: if two shapes are aligned, a straight connector is generated. If not, a right-angle connector will appear. -> Right click a connector to change its style.
Connect audit diagram Shapes Automatically
You can also use Connector tool under Home tab to connect shapes manually.

Step Four: add flowchart contents

To add text content to a shape or connector, double click it, and then type. Click on any blank area of the page to finish typing. After that, you have completed an audit flowchart. 
complete an Audit Flowchart

Step Five: save or export completed audit flowchart

Click Save on File tab to save as the default .eddx format, or you can also select Export & Send under File to export the audit flow chart to images, PPT, PDF, Word format .etc.
Export Audit Flowchart
Click flowchart examples to view and download more examples.
For more detailed information, please refer to How to Create a Fantastic Flowchart.

2016年12月25日星期日

Simple Steps to Create Workflow Diagrams

We know that workflow diagrams are commonly used in businesses and organizations. And now we will provide a simple guide on how to create workflow diagram with a professional diagram application.
Workflow Diagram Overview
A Workflow Diagram is a visual step-by-step guideline for completing a task or process. A successfully-built workflow chart not only depicts the flow of tasks and the steps to complete a job, but also identifies the critical steps and locates problem areas. It works as an invaluable analytical tool to help increase efficiency and avoid bottlenecks.
It enables every member involved in the work to understand the work sequence and what department will be handling what duties. It allows them to better understand not only their job responsibilities, but also other members’ roles, which increases accountability.

How to Create a Workflow Diagram

Start with the Exact Template

Start the software, the Workflow Diagram Template helps you easily create workflow diagrams using extensive built-in symbols. Find Workflow template from Business Diagram Category on the starting page and double click to enter the drawing page. You will discover abundant symbols and easy-to-use tools available for workflow diagrams.

Use Standard Built-in Symbols

Apart from basic flowchart shapes, this software also offers a large amount of high-quality built-in workflow symbols, which are categorized in three groups in the library as workflow objects, workflow steps and workflow departments. Besides, numerous illustrations are also available in use. All the symbols are in vector format and allowed for modification. Simply drag and drop any symbol you would like to use from the library pane. If you want to learn more on this part, please visit Workflow Diagram Shapes page for more information.

Basic Steps:

1. Start a blank workflow diagram drawing page:
On the File menu, point to New, point to Business Diagram under Available Templates, and double click the Workflow Diagram template. A new drawing page will open.
2. Add shapes:
Go to the library pane on the left of the canvas. Drag the shapes you need onto the canvas.
3. Edit text:
Double click a shape to edit text.
4. Resize a shape:
Click on the shape once to select the shape, and drag the green control handles to resize the shape.
5. Use floating arrows to connect an adjacent shape:
Hover your mouse over each shape and click one of the arrows that appears along its border to link it to an adjacent shape with a connector.
6. Change connector style: 
Right click on a connector and choose Convert to Right-Angle (Curved/Straight) Connector to directly change the connector style. To change the line color, weight, arrow style and etc., please go to Home tab, Line button for more options. Read Line and Line Ends to learn more about line setting. Please refer to Fine Tune Workflow Diagrams for detailed guide about final touches.
7. Print: When a workflow diagram is done, it’s easy to print and share with more people. On the file menu, point to Print to set for print options. You can change settings with fewer clicks and see the print preview in real time. Go to Print Diagrams for detailed information about printing.
8. Export: This software offers support for exporting your diagram to various formats, including Microsoft Office, PDF, and many other graphic formats. On the File menu, point to Export & Send for Export options. Find more instructions on Export diagrams to other Formats.

Workflow Examples

taxi-service-workflow

material-management-workflow
 
order-flowchart