An easy way on how to create flowchart using flowchart symbols will be introduced in following article.
Standard Flowchart Symbols and Their Usage
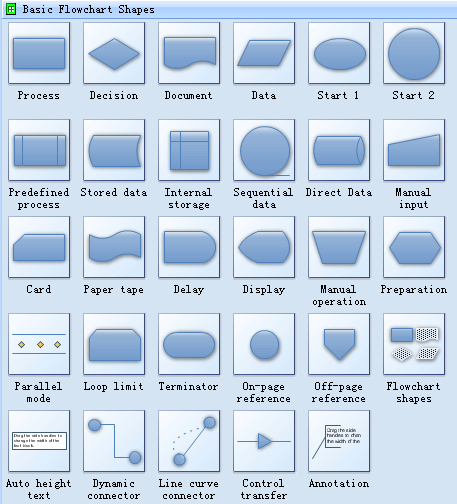
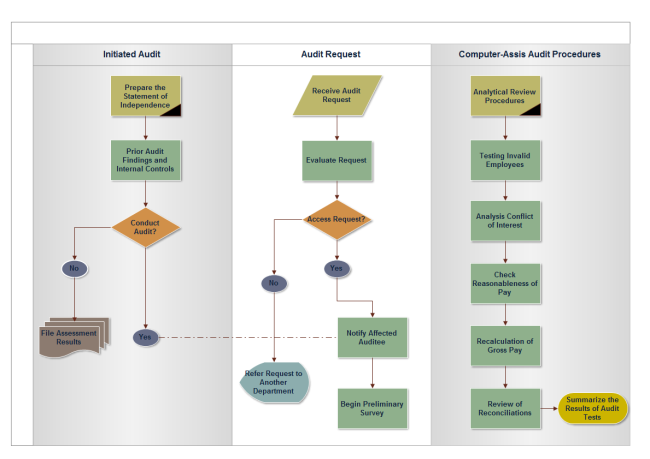
Flowcharts generally add symbols, such as connectors, rounded box, circle, etc together, which are usually used to represent how a process works, showing, at a minimum, the sequence of steps.
- Rounded box - is used to represent an event which occurs automatically.
- Rectangle or box - most frequently used symbol, represents an event that is controlled within the process.
- Diamond - shows a decision point in the process. Generally, the statement in the symbol will require a `yes' or `no' response and branch to different parts of the flowchart accordingly.
- Circle - demonstrates a point at which the flowchart connects with another process.
Create Flowcharts Using Flowchart Symbols
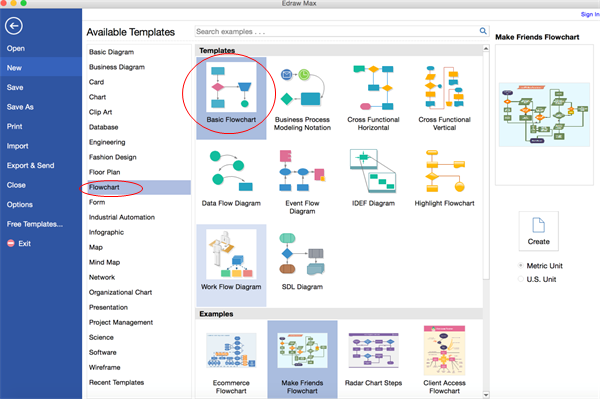
Step One: open a flowchart template
Go to File menu > New >Flowchart, and then double click Basic Flowchart to pen a blank drawing page for creating a flowchart.
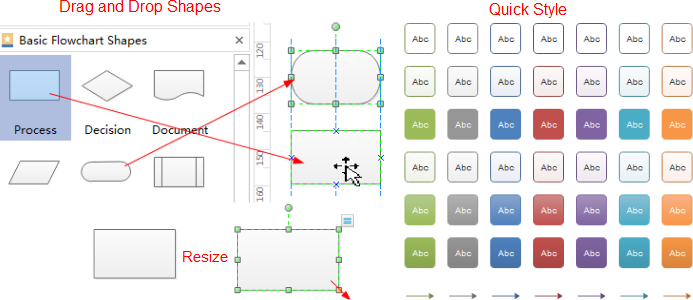
Step Two: add flowchart shapes to the diagram from library
Library on the left panel of the program covers all flowchart shapes needed to design a flowchart, simply drag and drop them onto your drawing page.
Tips: you can change a shape's color and border by clicking any style under the Home tab in the Styles group.
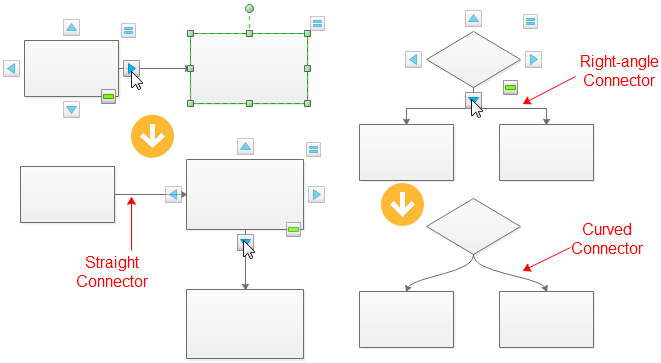
Step Three: connect flowchart shapes
Shapes are connected automatically by clicking the floating action button to generate connectors between two shapes.
Tips: if two shapes are aligned, a straight connector is generated. If not, a right-angle connector will appear. -> Right click a connector to change its style. You can also use <strong>Connector</strong> tool under <strong>Home</strong> tab to connect shapes manually.
Step Four: add flowchart contents
To add text content to a shape or connector, double click it, and then type. Click on any blank area of the page to finish typing. After that, you have completed a flowchart.
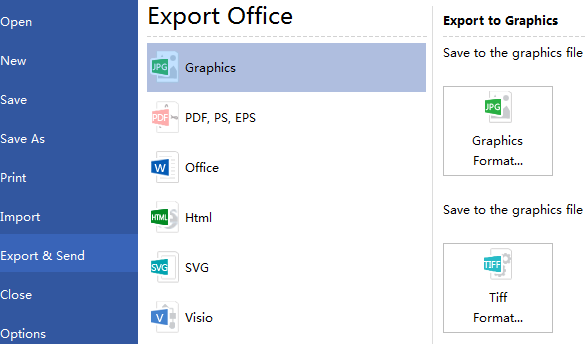
Step Five: save or export completed flowchart
Click Save on File tab to save as the default .eddx format, or you can also select Export & Send under File to export the audit flow chart to images, PPT, PDF, Word format .etc.
Standard flowchart symbols are used to draw flowcharts. There are many types of flowcharts eg: decision flows, process flows, swim-lanes. These can be drawn with standard symbols. The infographic type flowcharts can be drawn as you want as they do not follow a pattern strictly.
回复删除