显示标签为“flowchart maker”的博文。显示所有博文

2017年3月12日星期日

How to Create Business Process Analysis Diagram

Creating business process analysis diagram can increase your business process agility and efficiency, reduce implementation times and enhance quality.
Flowchart maker is ideal for analyzing and optimizing business processes for better productivity.
Business Process Analysis (BPA) is a discipline to identify business needs and provide solutions to business problems so organizations can achieve their goals and objectives. The main purpose of it is to solve the real problem and build the right solution. It uses various tools and methodologies to look at business processes in a variety ways and monitor the efficiency, productivity and more. analyzes various business operations classified into processes.
A flowchart is a type of diagram which represents a process with different symbols containing information about steps or a sequence of events.

Steps to Create Business Process Analysis Diagram

Flowchart maker is so smart that it can make business process analysis diagram drawing an interesting and effortless thing. Below are the detailed steps.
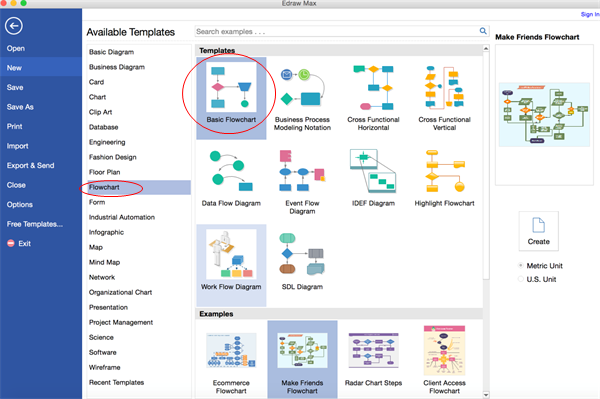
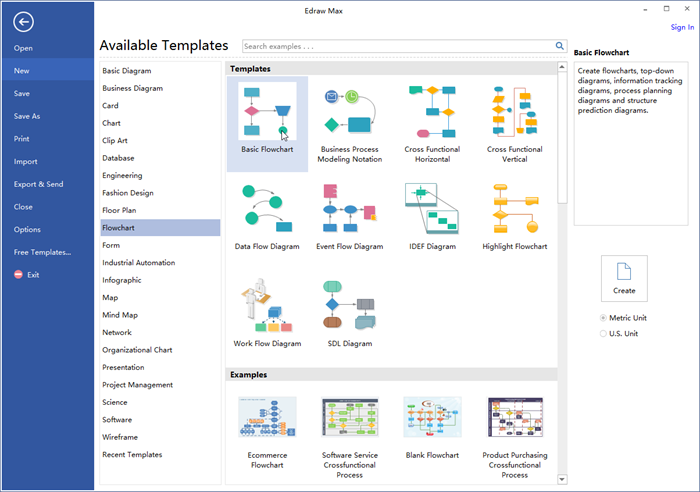
  1. Run the software, go to the File menu, click New > Flowchart, then double click Basic Flowchart icon to open a blank flowchart drawing page.
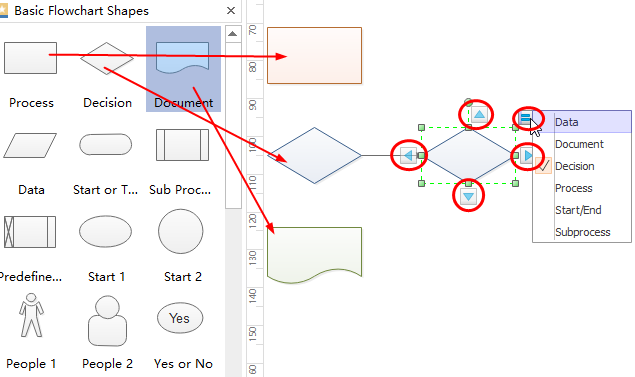
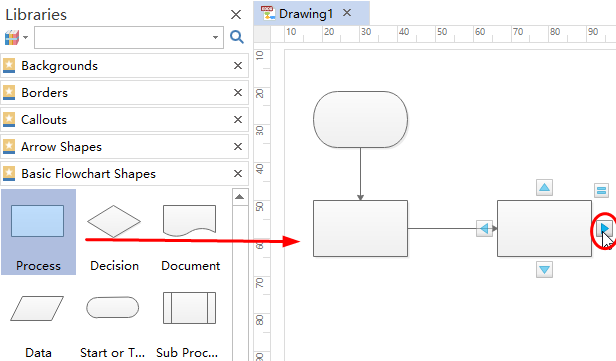
  2. Drag and drop flowchart symbols from left libraries, then double click symbols to add contents.
  3. Click floating buttons around the symbols to connect them automatically or go to Connector and choose a correct connector to connect symbols manually.
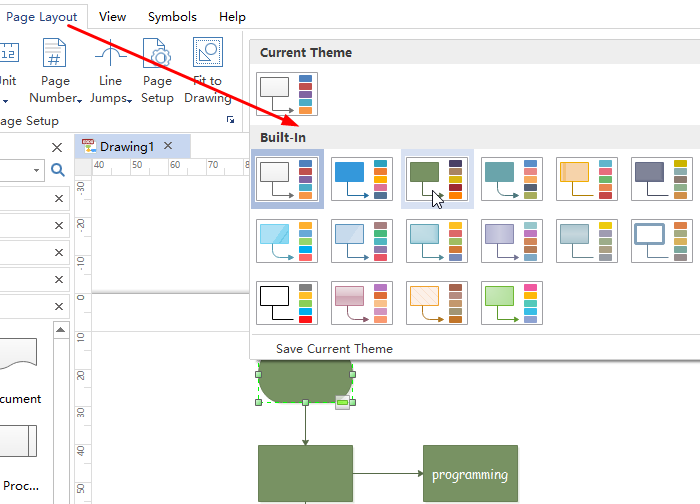
  4. Navigate to Page Layout and change the theme from various built-in themes if you are not satisfied with the current one.
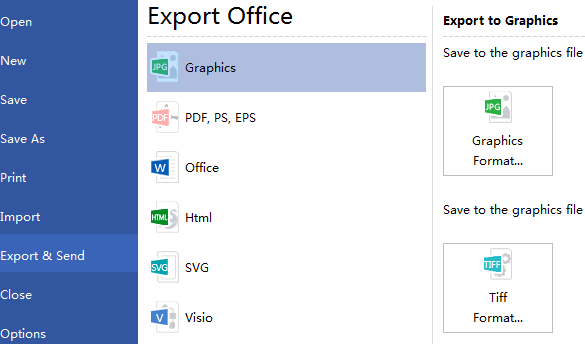
  5. Click Save on File tab to save as the default .eddx format, or you can also select Export & Send under File to export the decision making flowchart to images, PPT, PDF, Word format.etc.
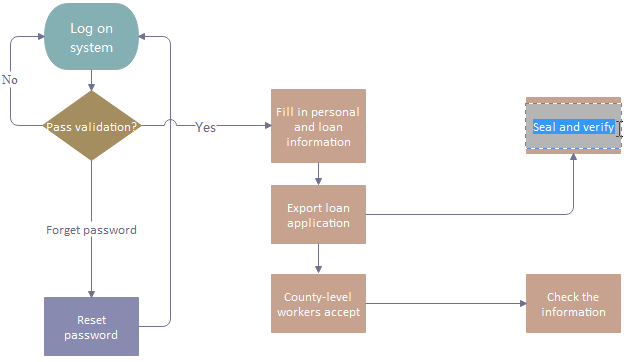
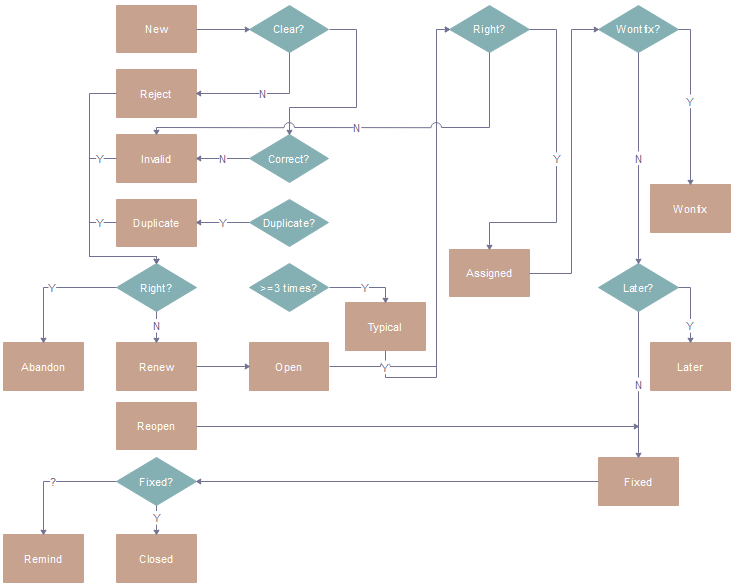
Below is the created business process analysis diagram example.
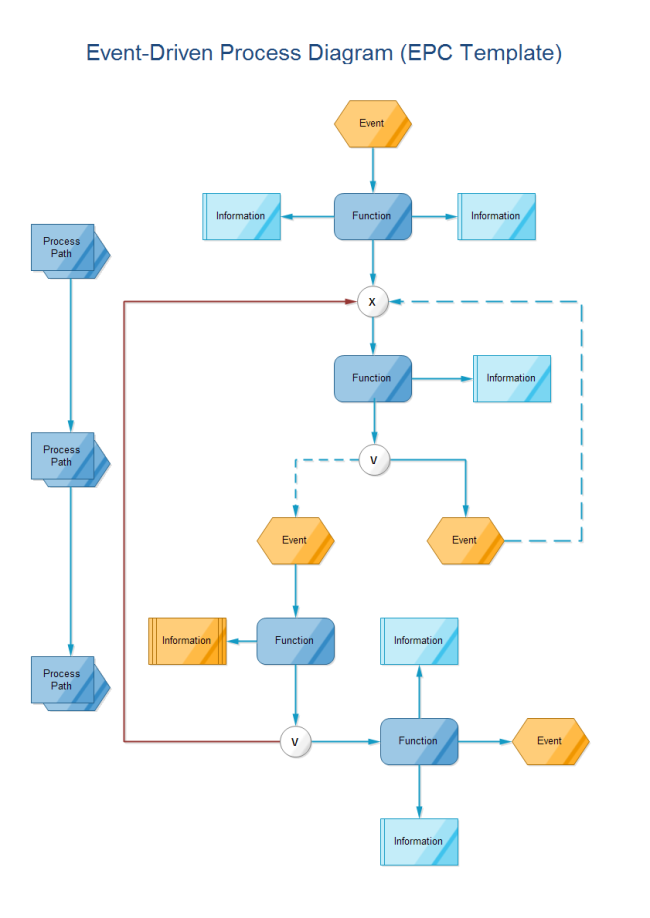
Event Driven Process Diagram

Software to Create Business Process Analysis Diagram

Flowchart maker has so many handy features which can simplify the flowchart creating process and enabling users to be hands-free, and that’s exactly why so many people choose it to create flowcharts.
Abundant Pre-made Flowchart Templates
It has hundreds of professionally designed flowchart templates for you to begin creating quickly. Just choose a template and edit it to suit your needs.
Automatic Formatting
It has smart drawing to let users connect, align and space shapes automatically. Users do not need to set the distance between shapes one by one by themselves, smart drawing will keep them the same.
Easy to Start
It has a large quantity of built-in flowchart symbols for drag-and-drop and similar interface with Microsoft help you get started effortlessly, no drawing skills required.

More Business Process Analysis Diagram Types

Except for flowchart, this flowchart maker has many other types of diagrams which can also create business process analysis diagrams.
SIPOC Diagram
SIPOC (suppliers, inputs, process, outputs, customers) is a visual tool for documenting a business process from beginning to end. Below is an business process analysis diagram example created by SIPOC diagram.
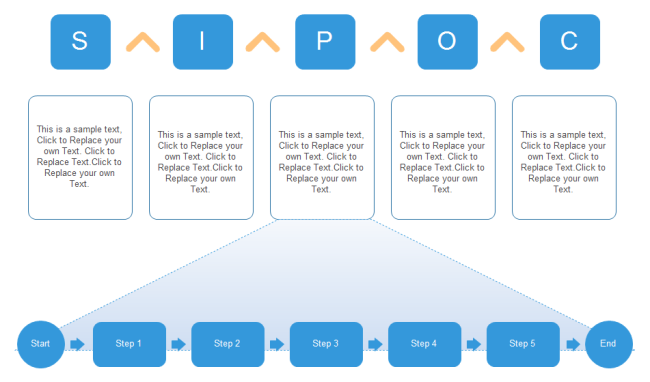
SIPOC Diagram
PCDA Cycle
PCDA (plan-do-check-act) is an iterative four-step management method used in business for the control and continual improvement of processes and products. It is also great for creating business process analysis diagrams and here is an example.
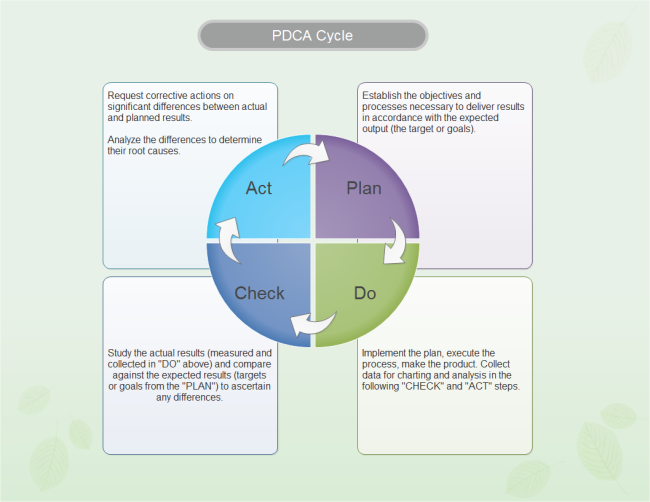
PCDA Diagram
SWOT Analysis
SWOT(strengths, weakness, opportunities, threats) is a structured planning method that evaluates those four elements of a project or business venture. It is a good tool to analyze the strength and weakness of your business process.
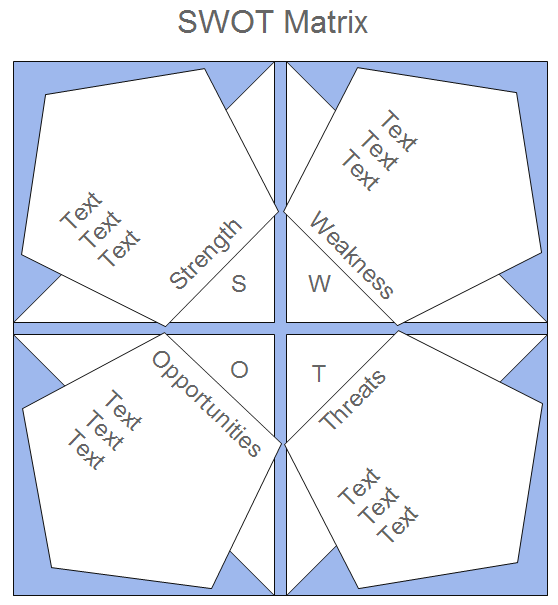
SWOT Diagram

2017年3月9日星期四

How to Create Flowchart for Switch Statement

Creating flowchart for switch statement is a good way for software engineers to improve clarity and offer the potential for faster execution.
Switch statement is one of computer programming languages, which means a type of selection control mechanism used to allow the value of a variable or expression to change the control flow of program execution via a multiway branch. It is easy to understand, read, maintain and verify that all values are handled. There are two main variants of switch statements, the first one is a structured switch, which takes exactly one branch, and the second one is unstructured switch which functions as a type of goto.
Flowchart is a formalized graphic representation of a logic sequence, workflow or manufacturing process, or similar formalized structure.
More and more people choose a professional flowchart maker to create their flowcharts for following incomparable advantages of it.
  • A mass of various standard flowchart symbols are provided for free drag-and-drop.
  • Abundant templates are offered for users to download, edit and print for free.
  • Smart drawing guide enables users to connect, align and space symbols automatically instead of doing those one by one by yourselves.
  • It supports inserting hyperlinks, attachments and notes to flowchart, which can make flowchart more resourceful and attractive.
Create your flowchart for switch statement effortless with below are simple steps.

Step 1. Open a Blank Drawing Page

Launch flowchart maker, go to the File menu, click New > Flowchart, then double click the icon of Basic Flowchart to open a blank flowchart drawing page.
Open a Blank Flowchart Drawing Page

Step 2. Add Flowchart Symbols

Drag and drop flowchart symbols from the left libraries or click the floating button around the symbols to add automatically and choose the proper shapes.
Add Flowchart Symbols

Step 3. Add Contents

Double click the symbols and text the key words, then click any blank area on the page to finish typing.
Add Software Testing Process Contents

Step 4. Connect the Symbols

There are two ways to connect the symbols. You can just click the floating button to connect symbols automatically or you can also choose a proper connector from Connector under the Home page to connect them manually.
Connect Flowchart Symbols

Step 5. Choose the Theme You Like

This maker provides many built-in themes which enables you to change the current theme if you do not like it.
Change the Theme

Step 6. Save or Export your Flowchart for Switch Statement

Click Save on File tab to save your flowchart as the default .eddx format, or you can also select Export & Send under File to export the flowchart to images, PPT, PDF, Word format .etc.
Export Software Testing Process Flowchart
And here is the created flowchart for switch statement.
Flowchart for Switch Statement

2017年2月7日星期二

How to Create Software Testing Process Flowchart

Software testing process flowchart is a great tool for software engineers to improve their work efficiency a lot.
Software testing is an investigation which conducted to provide information about the software quality or service under test for stakeholders. Software testing process normally includes 5 steps, which are planning and controlling, analysis and design, implementation and execution, evaluating exit criteria and reporting, and the final step is test closure activities. And software testing process flowchart is a professional diagram which graphically presents the whole process and enables engineers to record each step in detail, check and revise bugs effectively during the process.
Choose a smart Flowchart Maker which has following  incomparable advantages.
  • It provides various standard symbols for drag-and-drop and abundant flowchart templates for downloading and easy edition.
  • Its smart drawing guide enables users to connect, align and space symbols automatically with no need to do those one by one.
  • Users are allowed to insert attachment, notes and even hyperlinks to make flowchart much more resourceful and attractive.
This kind of flowchart maker prepares almost everything for you and you just need to click mouses to finish some drag-and-drop.

Step 1. Open a Blank Flowchart Drawing Page

Launch the software, navigate to File menu > New > Flowchart, and then double click the icon of Basic Flowchart in templates window to open a blank drawing page.
Open a Blank Flowchart Drawing Page

Step 2. Add Flowchart Symbols

Drag and drop the flowchart symbols from the left libraries or click the floating button around the symbols to add automatically and change the shapes.
Add Flowchart Symbols

Step 3. Add Contents

Just double click the symbols and text the key contents, then finish typing by clicking any blank area on the page.
Add Software Testing Process Contents

Step 4. Connect the Symbols

There are two ways to connect the symbols. You can just click the floating button to connect symbols automatically or you can also choose a proper Connector under the Home page to connect them manually.
Connect Flowchart Symbols

Step 5. Change the Theme

If you do not like the current theme, go to Page Layout and choose the theme you like from built-in themes, and then, you complete the software testing process flowchart with no difficulty.
Change the Theme

Step 6. Save or Export your Flow Chart for Loan Management

The default format for saving is .eddx but you can export and send it to various formats, such as Word, Excel, PDF, JPG, SVG, PPT, HTML, even Visio is supportable.
Export Software Testing Process Flowchart
And here is the created software testing process flowchart.
Software Testing Process Flowchart
Click flowchart examples to view and download more examples for free!


2017年1月21日星期六

Tutorial for Creating Product Development Flowchart

Product development flowchart visually outlines the essential processes of developing a new product, which enables product managers to follow up the project more effectively.

Introduction of Product Development Flowchart

Generally speaking, product development often happens when the characteristics of current products can not meet customers’ demand or can not offer any new or additional benefits to them. It typically includes following four main phases:
  • Fuzzy front-end (FFE) is the opening stage of a new product.
  • Product design is the process of designing the function and appearance of new product.
  • Product implementation refers to the phase of detailed engineering design of product including test process to make sure the product can meet the demand of customers.
  • Fuzzy back-end, also named commercialization phase which means launching the new product to the market.
And product development flowchart is a diagram which depicts these phases graphically and easy to follow through.

Steps to Create Product Development Flowchart

  1. Run the software, go to the File menu and open a blank drawing page.
  2. Drag and drop flowchart symbols from left libraries and double click to type information.
  3. Click the floating button or choose Connector in the Home page to connect symbols in order.
  4. Navigate to Page Layout and change the theme from built-in themes if you do not like the current one.
  5. Go to File menu again and click Save as, then browse your computer and choose a location to save your product development flowchart.
Then you successfully get a professional product development below.

Software to Create Product Development Flowchart

A good flowchart make should be equipped with following handy features.
  1. A large quantity of flowchart shapes are offered for dragging and dropping. No need to draw it by yourselves.
  2. It provides abundant various flowchart templates and examples for users to download and customize. Simply choose the template that you want, and edit it to fit your needs.
  3. Smart drawing of it enables users to connect, align and space shapes automatically. Once starting a shape, users can click the floating buttons to finish the rest, which improves the work efficiency dramatically.
  4. Users are allowed to insert hyperlinks, attachments and notes to flowchart, which can make it resourceful and enable audience to have a better experience.

More Flowchart Examples

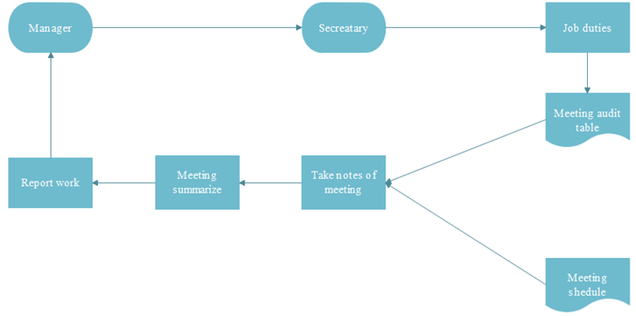
Flowchart Maker is not only professional for creating product development flowchart, but also professional for creating many other types of flowchart, such as sales process flowchart, construction flowchart, job duties flowchart and so on. Click flowchart examples to view more instances if you are interested. And all the examples are customizable and free to download. You can download it and edit it to suit yourself.


2017年1月15日星期日

How to Create a Construction Flowchart

Construction is the process of constructing a building or infrastructure. It is very serious and rigorous, so before starting constructing, engineers will draw a construction flowchart to help themselves check the whole process and find if there is any mistake.
This article will give you a brief introduction of construction and an outstanding flowchart creator to draw the construction flowchart.

What is Construction and Construction Flowchart?

There are main three types of constructions: building, infrastructure and industrial. And their major steps are almost the same.
  • Create floor plans and prepare a material list.
  • Obtain necessary building approval.
  • Clear the building site and lay the foundation.
  • Build the main load-bearing structure and add floor and ceiling joists.
  • Cover outer walls and install essential internal windows, plumbing and other utilities.
  • Finish the rest installation of necessary equipment.
Construction flowchart is a series of flowchart symbols which connect the detailed steps of construction. It uses graphic symbols to represent the complicated and rigorous process vividly and understandably.

How to Draw a Construction Flowchart?

Drawing a construction flowchart with a smart flowchart creator, Flowchart Maker, makes difficult thing easy. Just follow the below steps and you will find drawing a construction flowchart is incredibly simple.
  1. Drag relevant symbols of flowchart and drop them on the page.
  2. Text each step into right symbols.
  3. Connect the symbols with arrow in sequence.
  4. Complete and recheck the construction flowchart.
Then you can get an attractive construction flowchart. A professional and rigorous construction flowchart can help engineers find out the potential mistake and avoid causing serious consequence. Below is a construction flowchart example for your reference.
Construction Flowchart

2017年1月12日星期四

How to Create a Sales Process Flowchart

Map out and create a sales process flowchart to help people understand complicated sales process.
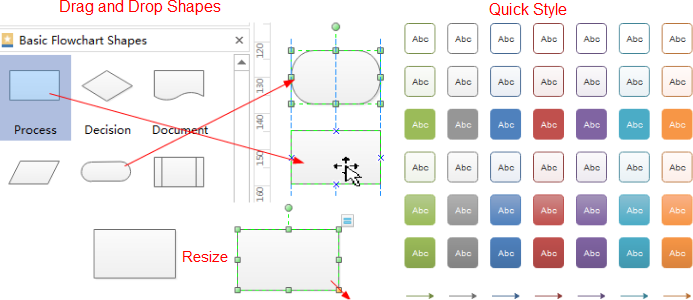
Following are some guidelines to help you create a more professional-looking sales process flowchart.

What is a sales process?

In simple terms, a sales process is a systematic process involving a series of steps that enables a sales force to close more deals, make more profits and make more sales through referrals. It mainly includes following steps.
  • Product knowledge is a basic requirement to go on sales process. When a person is extremely versed in a particular product, he has bigger chance to get more orders.
  • Prospecting means searching potential customers in demand. It’s better to create a customer database to record their information for follow-up.
  • Approach means to try many ways to contact the potential buyer. Generally speaking, a telephone call is better than emails, cause many promoting emails enter into junk mail box.
  • After contacting with a customer, you should assess his needs by asking questions.
  • You can make a convincing presentation after you assessing the needs of customer.
  • The final step is as getting an order from customer.
Sales process flowchart aims to make this complex process easy to understand by drawing some symbols and connectors.

How to Draw a Sales Process Flowchart?

  1. Launch a flowchart maker.
  2. Drag relevant flowchart symbols and drop them on the page.
  3. Text steps of the process into right symbols.
  4. Connect the steps with arrow according to their importance and correct order.
  5. Try to improve sale process flowchart if it needs.
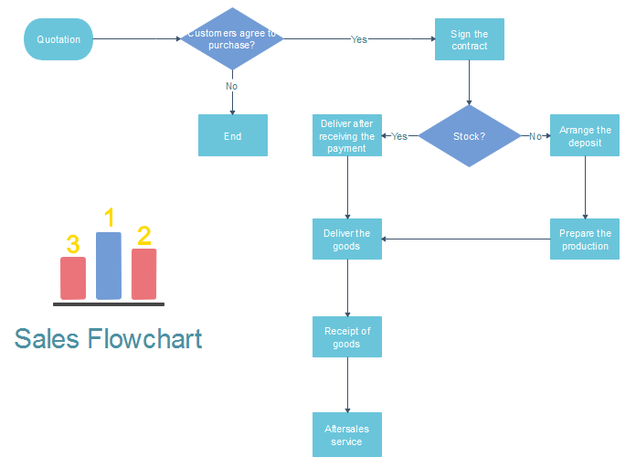
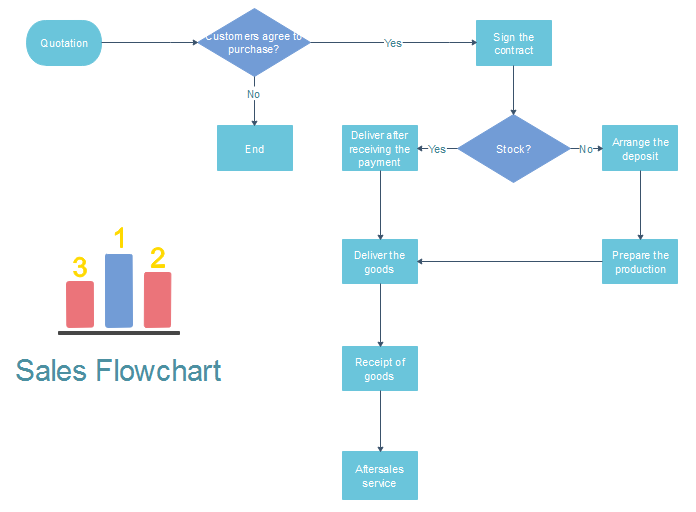
Below is a simple sales process flowchart for your reference. You can understand the whole process easily with this flowchart.
Sales Process Flowchart

2017年1月10日星期二

How to Create a Professional Order Process Flowchart Quickly

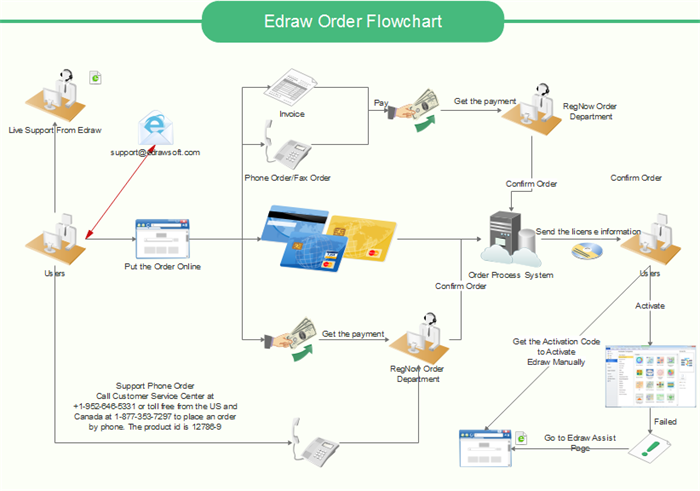
Have you ever met with the problem that you do not know what to do and who should be responsible for to process an order? Then you need an order process flowchart to help you have a better understanding about order process.
This article mainly talks about Four parts. The first part is the whole process of order and definition of order process flowchart. The second part is functions of flowchart.The third part is steps to create an order process flowchart. The final part is introduction of professional flowchart software.

Whole Process of Order and Definition of Sales Order Process Flowchart

The whole process of order has 7 steps. Normally start from finding customer in demand, quoting for customer, negotiating price with customer. If the customer is satisfied with the price and quality, he/she will place the order and arrange the payment. Then the supplier prepare the goods and deliver the goods. The whole process of order ends with receipt of goods. Sometimes, there may be repeated orders from customer.
And order process flowchart is a diagram to describe the systematic flow of the whole process from the suppliers to customers and show relationship between the major parts of the process.

Functions of Flowchart

Flowchart is a wonderful tool used to describe complicated ideas or process in a visual and graphical manner. It uses a series of symbols and text to makes complex systems work easily. Flowchart can also help CEOs, general manger and other organization planners to assess the flow of data and make it easier to find the reason if there is something wrong.

Steps to Create an Order Process Flowchart

  1. Find out the staffs or corresponding departments involved in the process or function, and listed them on the page.
  2. List the steps in the process through brainstorming.
  3. Connect the steps with arrow according to their correct order.
  4. Discuss to improve and perfect the flowchart.
With this visual order process flowchart, you can easily understand the whole process of order and know the function of each step. Below is a simple order process example for you.
Order Process Flowchart Software

Order Workflow Chart Example

You can also use graphic representation to show order process instead of using standard flowchart symbols. This kind of flowchart we call it "Workflow". Here is an workflow example of order process.
Order Workflow Example

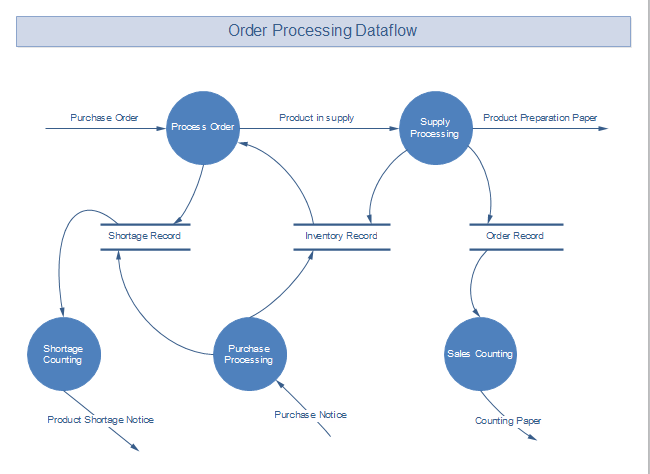
Order Processing Data Flow Chart

Sometimes developers also would like to use another type of flowchart - data flow diagram. Here is an order processing data flow example. You can click the image to download this template if you need it.
Order Processing Data Flow

2017年1月8日星期日

How to Create a Quotation Flowchart

A quotation flowchart enables sales people know the process of the order and take actions appropriately to close the order with customers.
If you are wondering what is quotation flowchart and how to create it to help you get more orders, follow this article and you will find the answer you want.

Quotation Flowchart Definition

The definition of quotation is telling the cost of goods or service to a potential customer before they commit to the purchase. The price of goods or service are relatively stable once a seller sends a quotation
And quotation flowchart is a diagram which visually depicts the detailed process of quotation from receiving an inquiry to the final closing an order. It lets sales people know how does the order go on and what should they do to proceed the order.

Steps to Create Quotation Flowchart

After knowing the definition of quotation flowchart, it’s time to create it. Drawing a quotation flowchart with a Flowchart Maker is much more effortless than you think.
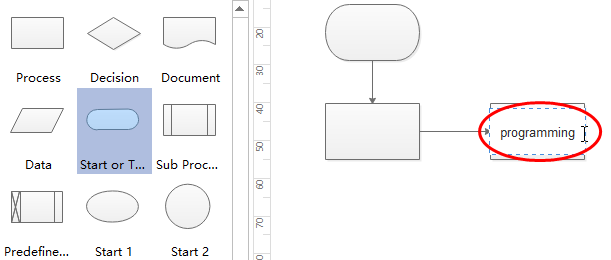
  1. Run the software and open a blank flowchart drawing page.
  2. Open a Blank Drawing Page
  3. Add flowchart symbols by dragging from the left libraries or click the floating button.
  4. Add Flowchart Symbols
  5. Double click the symbols and text the information.
  6. Add Content
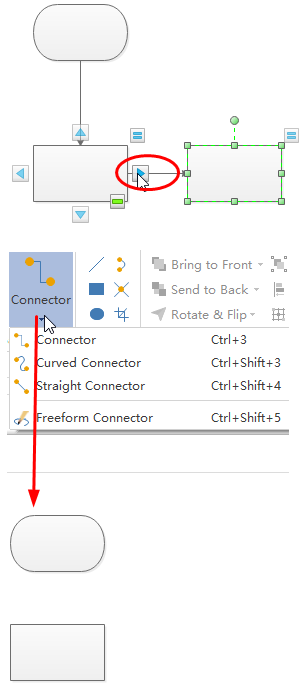
  7. Click the floating button or choose Connector in the Home page to connect the symbols.
  8. Connect Symbols
  9. Click Page Layout and choose the theme from built-in themes if you do not like the current one.
  10. Change the Theme
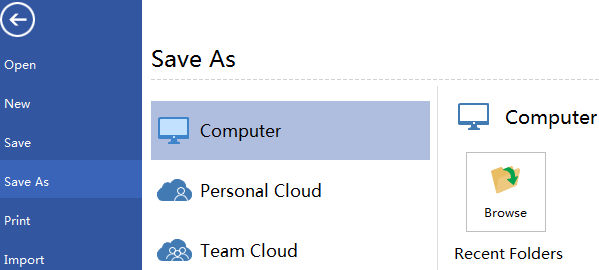
  11. Browse your computer and choose a location to save your quotation flowchart.
  12. Save Programming Flowchart
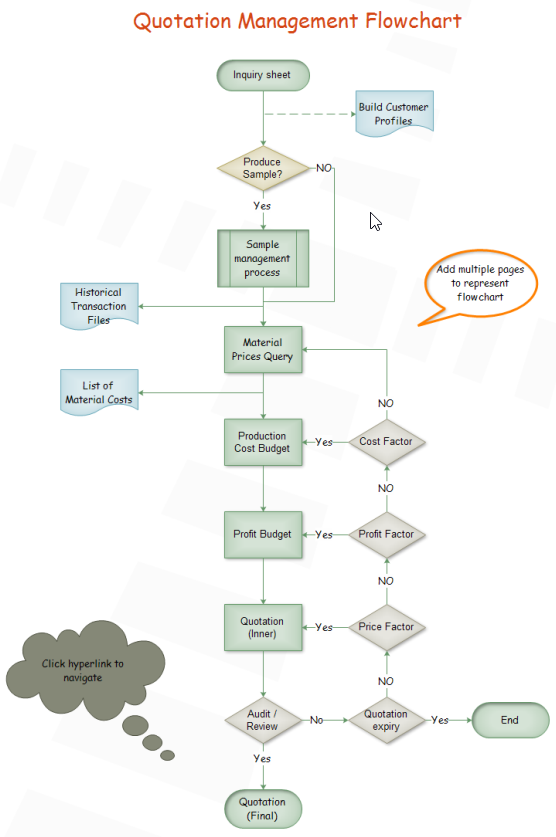
Here is a quotation flowchart example for you.
Quotation Flowchart

More Flowchart Examples

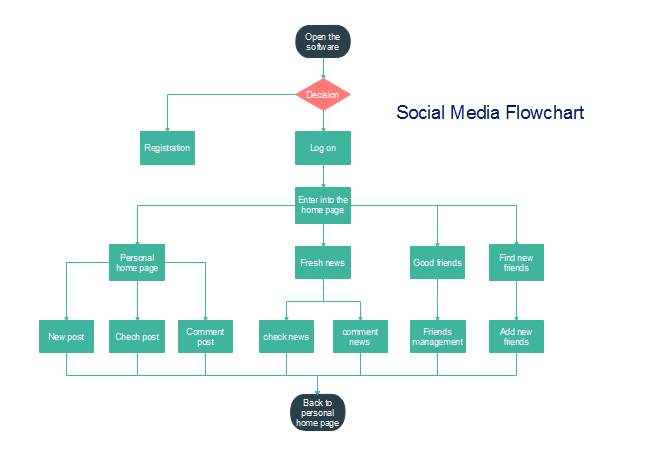
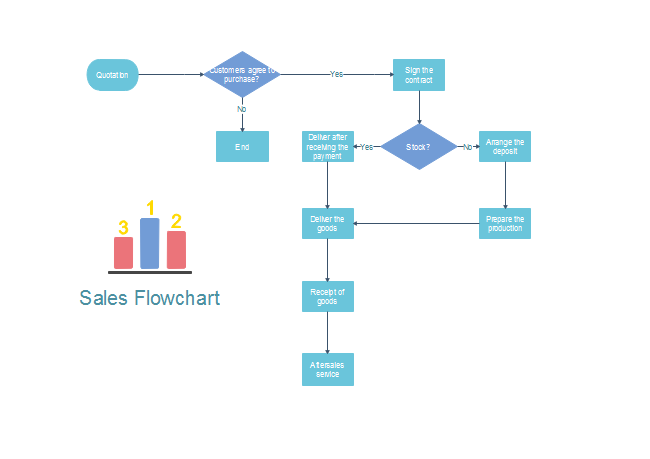
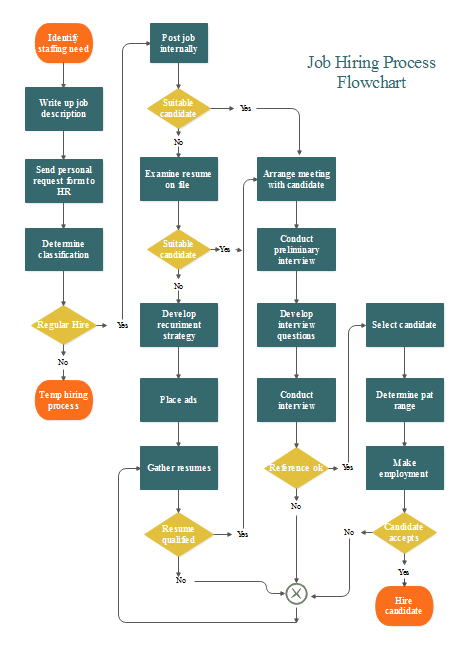
Except for quotation flowchart, Edraw Flowchart Maker can also create many other flowcharts, such as social media flowchart, sales process flowchart, construction flowchart and so on. Click flowchart examples to view and download more examples if you are interested.
Social Media Flowchart
Sales Process Flowchart
Job Hiring Flowchart

2017年1月4日星期三

Quick Steps to Create Employee Performance Evaluation Flowchart

Employee performance evaluation flowchart is a great tool not only for employers to evaluate the contributions employees made to companies and but also for employees to improve their performance according to the evaluation criteria during the process.

Introduction of Employee Performance Evaluation Flowchart

Employee performance evaluation, which provides employers with a chance to assess their employees’contributions to the company, is not only essential to developing a powerful work team, but also is a key component for employees’ development. The employee performance evaluation flowchart process includes setting goals, measuring performance, performance feedback, employee recognition and documentation of employee progress.
Employee performance evaluation flowchart uses standard symbols to present the whole process graphically and understandably, both employers and employees can make use of it to meet their own needs.
Quick Steps to Create Employee Performance Evaluation Flowchart - Image 1

Steps to Create Employee Performance Evaluation Flowchart

Follow these simple 5 steps, and you will find creating flowchart with a professional flowchart maker is such an effortless and interesting thing.

Step One: open a flowchart drawing page

On the File menu, go to New >Flowchart, and then double click Basic Flowchart to pen a blank drawing page for designing an employee performance evaluation flowchart.
Quick Steps to Create Employee Performance Evaluation Flowchart - Image 2

Step Two: add flowchart shapes to the diagram from library

Library on the left panel of the program contains all flowchart shapes needed to make a performance management flowchart, simply drag and drop them onto your drawing page.
Tips: you can change a shape’s color and border by clicking any style under the Home tab in the Styles group.
Quick Steps to Create Employee Performance Evaluation Flowchart - Image 3

Step Three: connect flowchart shapes

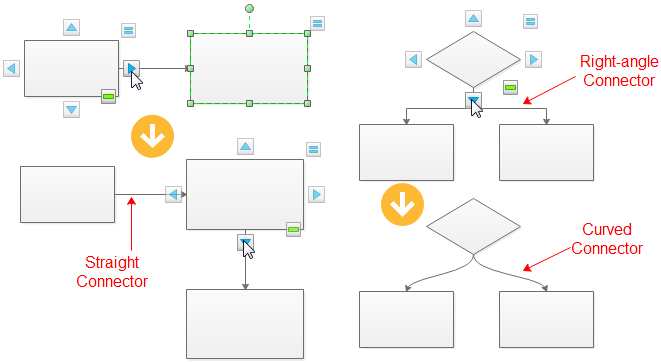
Shapes are connected automatically by clicking the floating action button to generate connectors between two shapes.
Tips: if two shapes are aligned, a straight connector is generated. If not, a right-angle connector will appear. -> Right click a connector to change its style.
Quick Steps to Create Employee Performance Evaluation Flowchart - Image 4
You can also use Connector tool under Home tab to connect shapes manually.

Step Four: add flowchart contents

To add text content to a shape or connector, double click it, and then type. Click on any blank area of the page to finish typing. After that, you have completed an evaluation flowchart.

Step Five: save or export completed employee performance evaluation flowchart

Click Save on File tab to save as the default .eddx format, or you can also select Export & Send under File to export the flowchart to images, PPT, PDF, Word format, etc even Visio format.
Quick Steps to Create Employee Performance Evaluation Flowchart - Image 5